? USD/JPY Awaits Last Lower Low Before Bull Reversal ?

Dear traders,
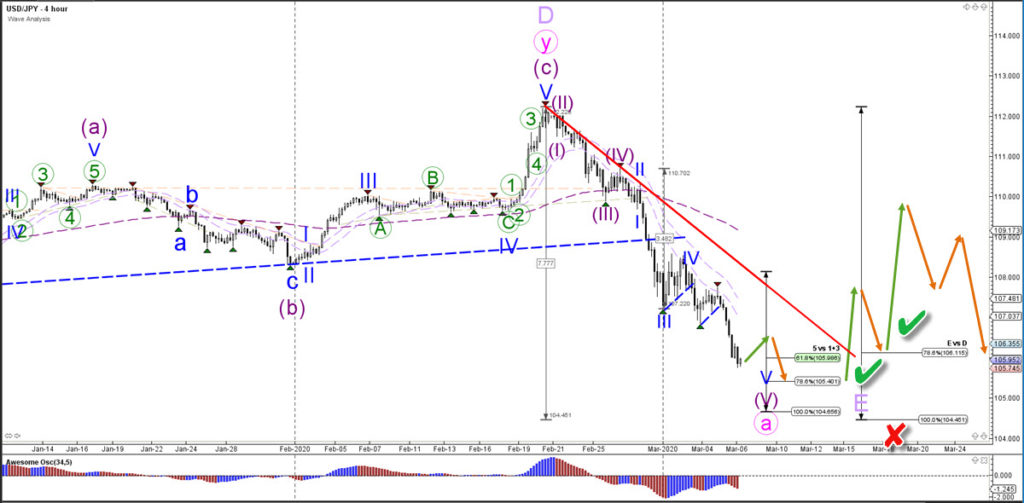
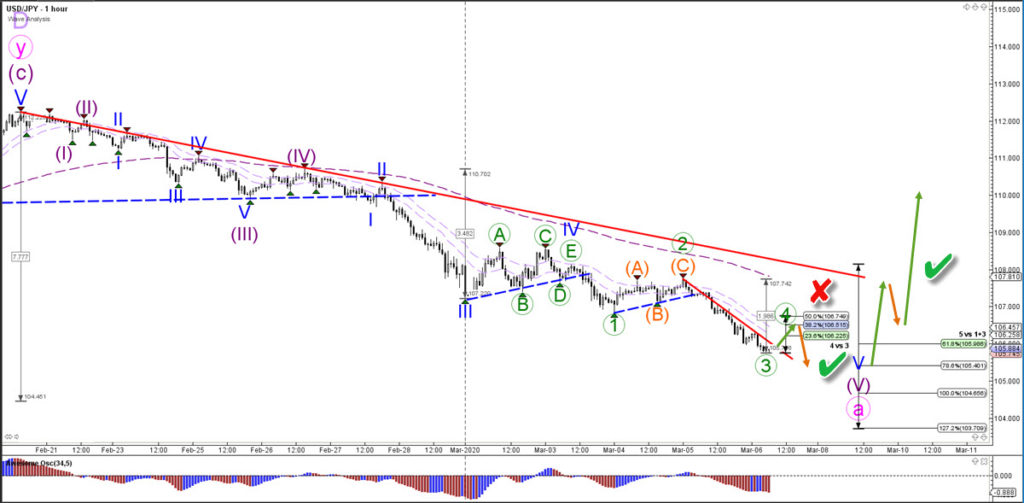
the USD/JPY made more bearish breakouts after pushing below support (dotted blues). The momentum remains strong and one more lower low is likely.
USD/JPY
4 HOUR Chart
The USD/JPY is expecting to make a bullish reversal above the 100% Fibonacci level. This could confirm the completion of wave A (pink) and kick start a wave B retracement. If price action fails to bounce above the 100% Fibonacci level, then the wave E (purple) triangle pattern becomes invalidated (red x).
1 HOUR Chart
The USD/JPY is likely to create a wave 4 (green) pullback as long as price stays below the 50% Fibonacci retracement level. A break above the 50% Fib invalidates (red x) the wave 4 (green). A new lower low could be followed by a bullish bounce as price completes the wave A (pink).
The analysis has been done with SWAT method (simple wave analysis and trading).
For more daily wave analysis and updates, sign-up up to our ecs.LIVE channel.
Good trading,
Chris Svorcik
Elite CurrenSea


Leave a Reply