❗️ Oil Reaches Major Decision Zone for Break or Reverse ❗️
January 18, 2019
2 min read
Subscribe
Hi traders,
Oil showing a bullish break above the resistance trend line (dotted red) but the space is limited due to the 38.2% Fibonacci resistance level of wave 4 vs 3. The Fibonacci levels could be strong zones and cause a potential reversal back down.
US OIL
4 hour
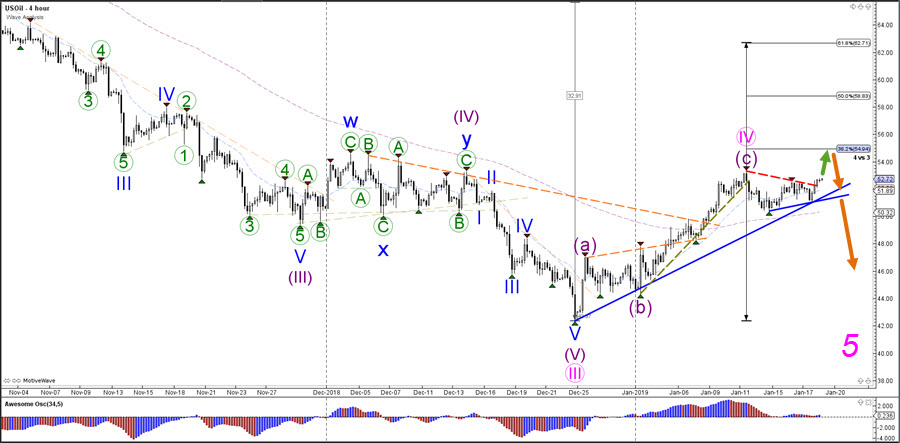 Oil is currently in a wave 4 (pink) pattern unless price manages to break above the 50-61.8% Fibonacci retracement levels. A break below the support trend lines (blue) would indicate a bearish breakout and potential for a downtrend continuation within wave 5 (pink).
For more daily wave analysis and updates, sign-up up to our ecs.LIVE channel.
Good trading,
Chris Svorcik
Elite CurrenSea


Leave a Reply