☝️ NZD/USD Offers Trading Ideas for USD Reversal Bulls ☝️

Dear traders,
the NZD/USD is breaking the daily chart support trend line. The US Dollar is picking up steam and this is clearly visible on the NZD/USD. How deep can the retracement go?
NZD/USD
Price Charts and Technical Analysis
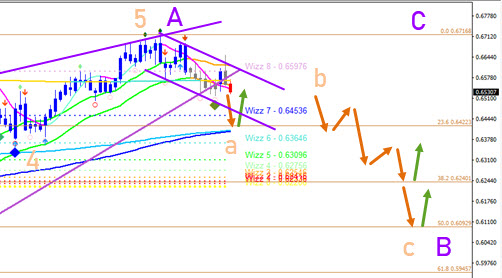
The NZD/USD seems to have completed a 5 wave (orange) pattern. This could indicate the end of a wave A (purple / or wave 1) and the start of a bearish pullback. If price action is indeed building a wave B (purple / or wave 2), then a decline towards the Fibonacci retracement levels is likely.
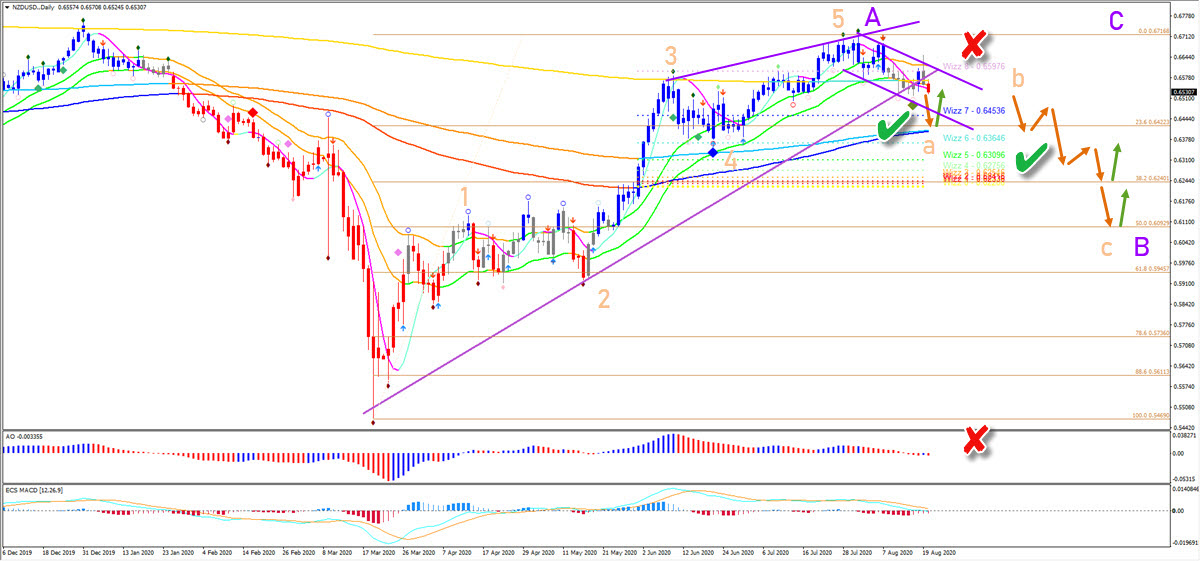 The bearish channel offers a clear outline of the downtrend. A bounce at the 23.6% Fibonacci could occur but price is likely to continue within the bearish channel. Only a break above 0.56 and the 21 ema zone would make such a bearish scenario unlikely (red x).
analysis has been done with SWAT method (simple wave analysis and trading).
For more daily technical and wave analysis and updates, sign-up up to our newsletter.
Good trading,
Chris Svorcik
Elite CurrenSea


Leave a Reply