GBP/JPY Starting Wave 5 ? If Price Breaks Channel Resistance ?
Subscribe
Dear Traders,
The GBP/JPY is struggling to find direction but we might see more guidance if we step back and look at the 4 hour chart.
Here we are able to see a potential start of a wave 5 if price is able to confirm the bullish break of the bullish channel.
Today’s analysis is focused on the GBP/JPY wave patterns. For more free analysis, make sure to check ecs.LIVE.
GBP/JPY Channel: New Uptrend or Bear Flag?
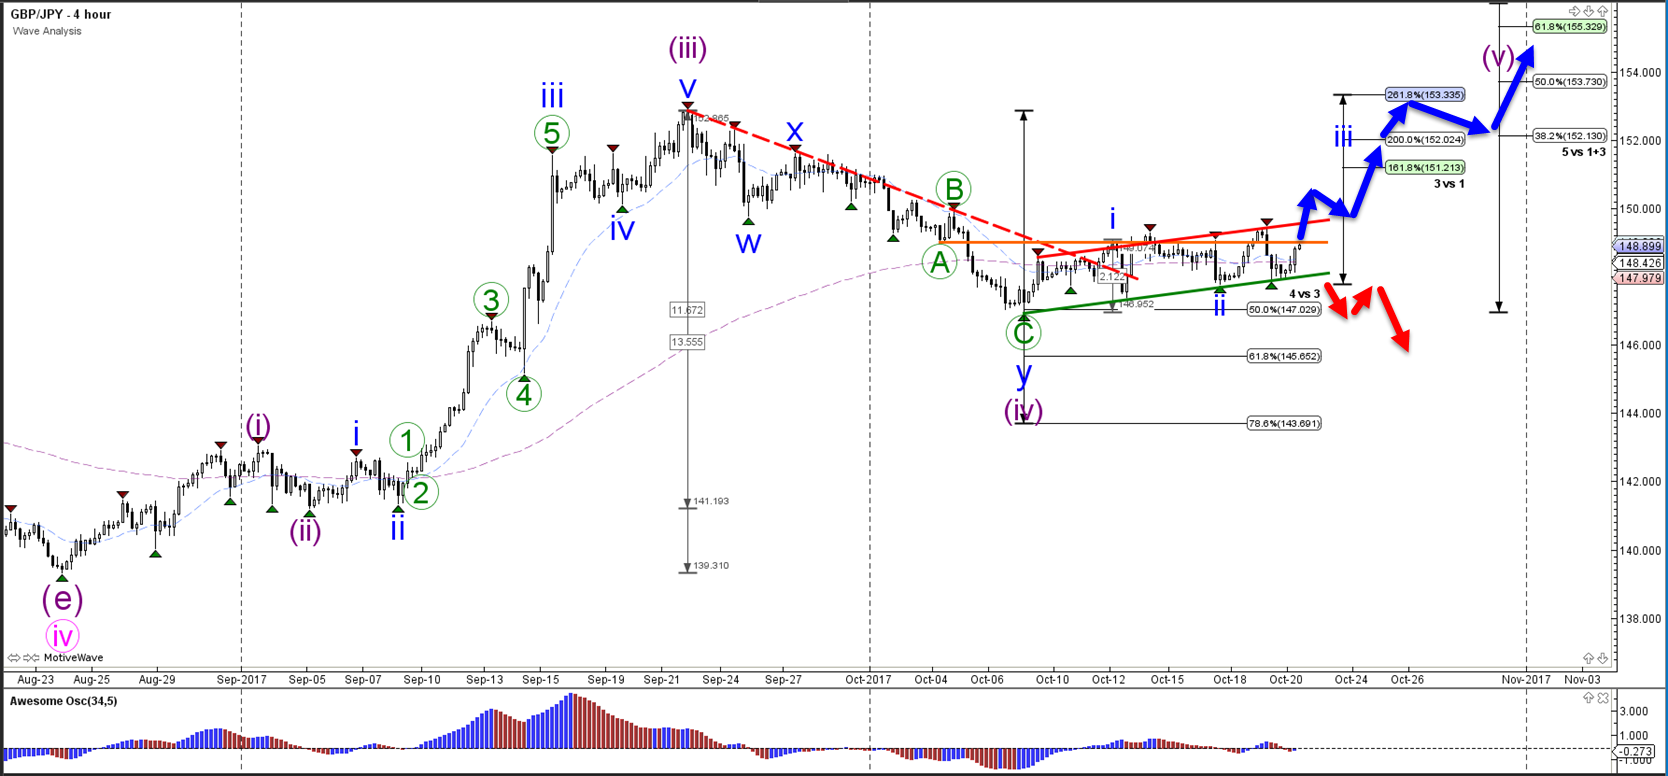
The GBP/JPY bullish momentum was a particularly strong price swing which took price up above 152.50. This swing has been marked as wave 3 (purple) due to the impulsive character of the price action.
The subsequent correction retraced back to the 50% Fibonacci level of wave 4 versus 3 at around 147 and price bounced at this key support Fib.
The bullish bounce was not that strong and price has made a shallow angled bullish channel, which also could be seen as a bear flag chart pattern due to its corrective character.
Is the GBP/JPY back in the uptrend as part of the wave 5 (purple) or will there be a deeper bearish correction?
GBP/JPY Key Decision Zones
The channel lines are critical for the direction of the GBP/JPY. At the moment a bullish continuation of wave 5 seems the most likely scenario but a break below the channel support (green line) would chance that outlook to a a larger bearish correction.
The bullish structure, however, is also confirmed once price breaks above the resistance (orange/red lines) of the trend channel and price reaches at least the 161.8% Fibonacci target of the wave 3
Let’s talk about targets.
1.) The bearish breakout target is aimed at the 61.8% Fibonacci level of wave 4 vs 3 at around 145.
2.) The bullish breakout target is 61.8% Fib target of wave 5 (purple) but this might take a long time before price reaches the target. A closer and quicker target could be 151 and 153.
Many green pips,
Chris


Leave a Reply