? GBP/USD Wave C Bounce at 144 ema and 1.30 Support ?

Dear traders,
the GBP/USD completed the bearish wave C (pink) as indicated in yesterday’s analysis. Can the Cable make the bullish rally to complete wave 5 (purple)?
GBP/USD
Price Charts and Technical Analysis
The GBP/USD made a bearish bounce as part of wave B (pink) and a bullish bounce at the end of wave C as expected. Usually speaking, the analysis focuses on a different currency pair or financial instrument each trading day. But today’s wave analysis is again on the GBP/USD to show how understanding wave patterns can help determine expected price swings and the potential bounce spots. Yesterday’s analysis helped identify the wave B and C (pink).
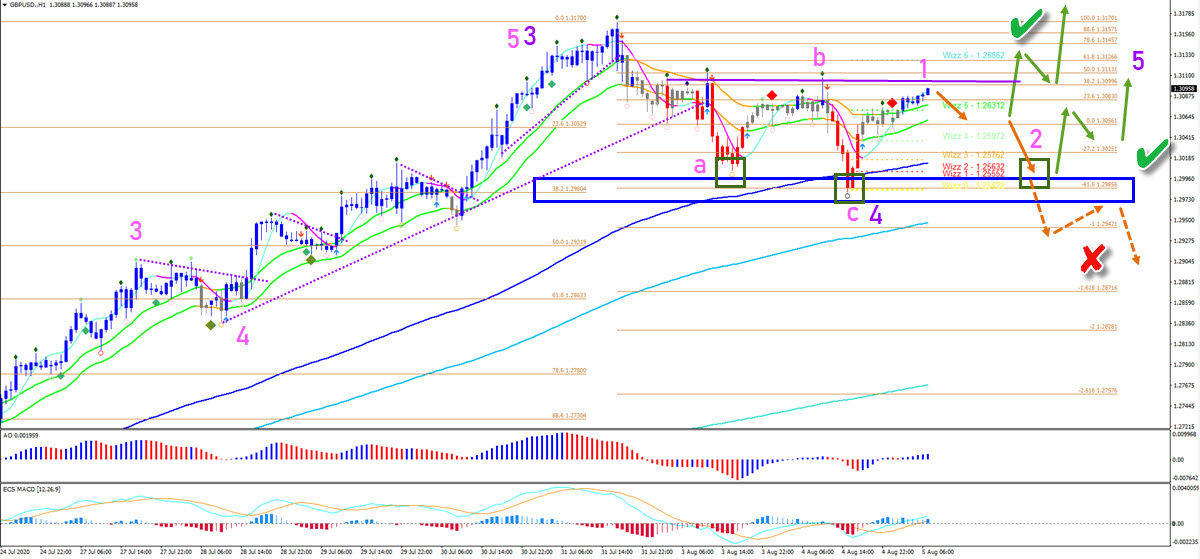
In today’s analysis, the main consideration is whether price is now in a wave 1-2 (pink) or in a complex WXY correction of wave 4 (purple). A wave 1-2 (pink) within wave 5 (purple) could see a bounce at support (green box) for an inverted head and shoulders pattern. Also a bullish breakout would confirm it. A break below the support zone (blue box) indicates either a complex correction in wave 4 with the 50% Fib (purple box) playing a key role or a reversal (red x).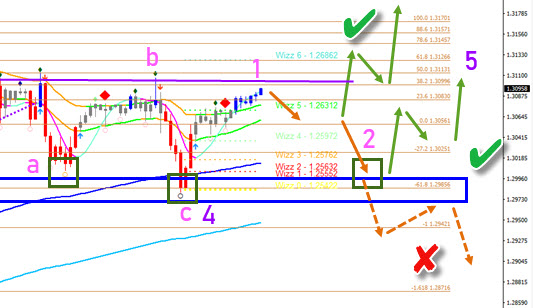
The analysis has been done with SWAT method (simple wave analysis and trading).
For more daily technical and wave analysis and updates, sign-up up to our newsletter.
Good trading,
Chris Svorcik
Elite CurrenSea


Leave a Reply