? GBP/USD Wave 3 Pattern Confirms Bullish Momentum ?

Dear traders,
the GBP/USD made a bullish breakout as expected in our previous wave analysis. The bullish price action has reached the first target at 1.3250. Can the GU, aka the Cable, continue with its bullish momentum?
GBP/USD
Price Charts and Technical Analysis
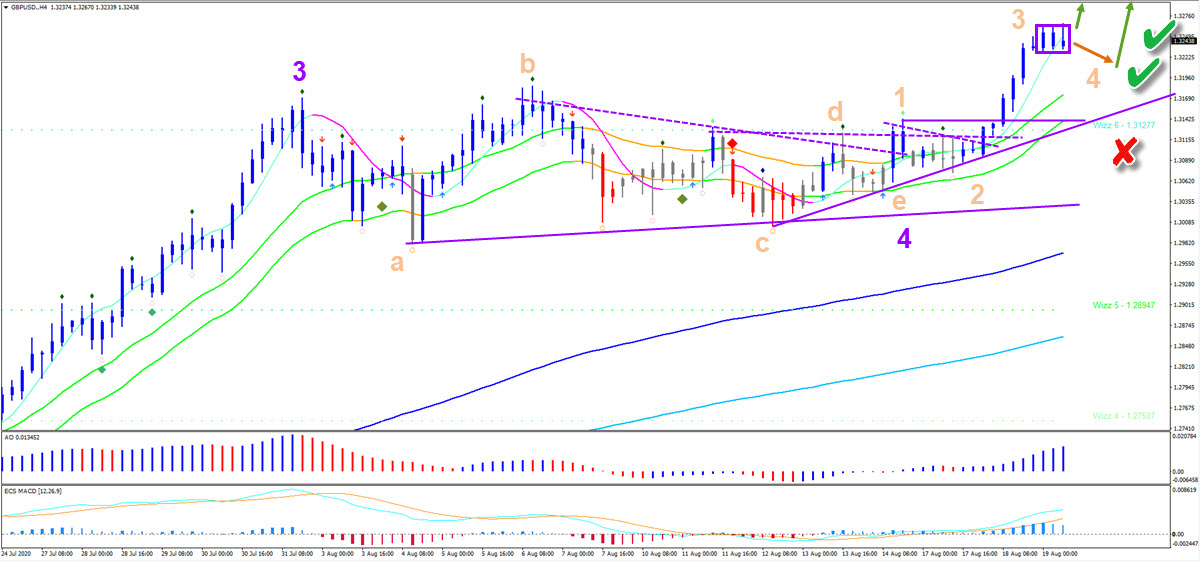
The GBP/USD seems to be building a wave 3 (orange). The wave 3 could still be in development – if price action pushes aboves the candle highs (purple box). Eventually a shallow pullback should take place as part of wave 4. A bullish bounce could occur at the 21 ema zone.
The GBP/USD next target is aiming at 1.35. Only a strong bearish retracement invalidates (red x) the wave 3-4 pattern. Otherwise, price action has completed the wave 4 (blue) triangle pattern as expected and a restart of the uptrend is in full swing.
The analysis has been done with SWAT method (simple wave analysis and trading).
For more daily technical and wave analysis and updates, sign-up up to our newsletter.
Good trading,
Chris Svorcik
Elite CurrenSea


Leave a Reply