? GBP/USD Testing Limits of Wave-4 Bear Flag Pattern ?
Subscribe
Hi traders,
The GBP/USD is building a bear flag chart pattern, which is often indicating a trend continuation. Price needs to break the support of the bear flag before a downtrend continuation is confirmed.
GBP/USD
4 hour
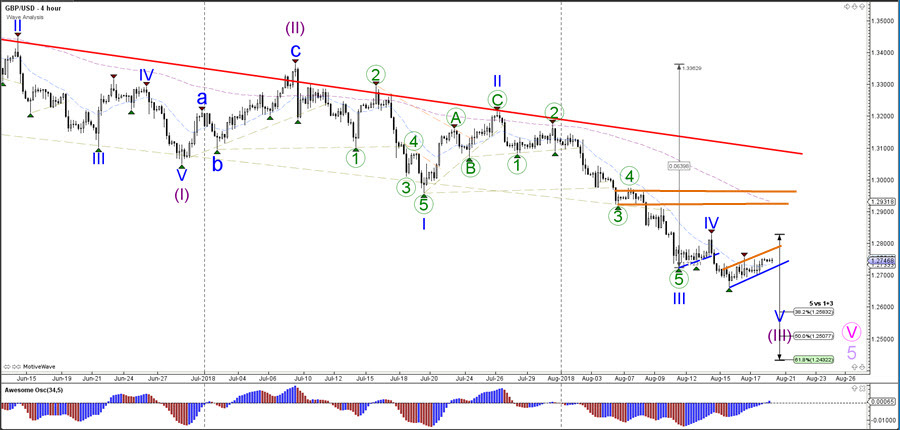
The GBP/USD bearish breakout could head towards the Fibonacci targets of wave 5 (blue) of wave 3 (purple). A bullish break above the flag remains a potential retracement as long as price stays below 1.2950.
1 hour
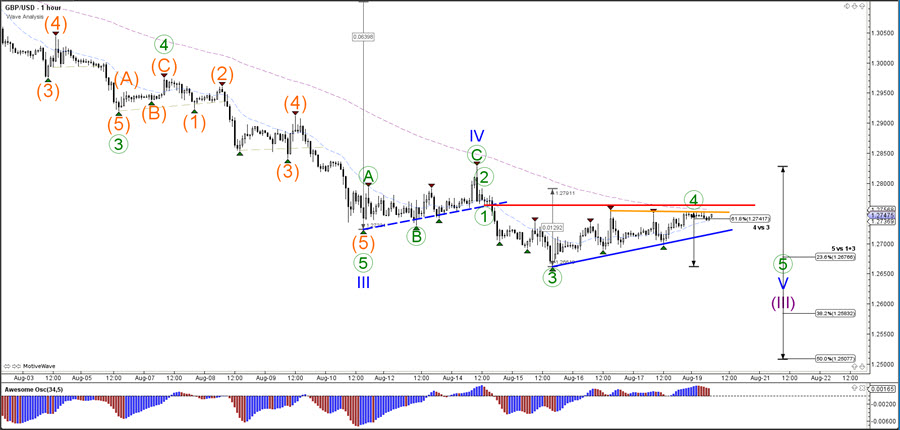
The GBP/USD could be in a wave 4 (green) although the lengthy sideways consolidation zone is making the wave pattern more vulnerable to a deeper bullish correction. A bearish push below the support trend line (blue) indicates the potential breakout whereas a bullish breakout above the resistance trend line (red) invalidates wave 4 (green).
Good trading,
Chris Svorcik
Elite CurrenSea


Leave a Reply