? GBP/USD Testing Key 1.2950 Support Zone of Triangle ?

Dear traders,
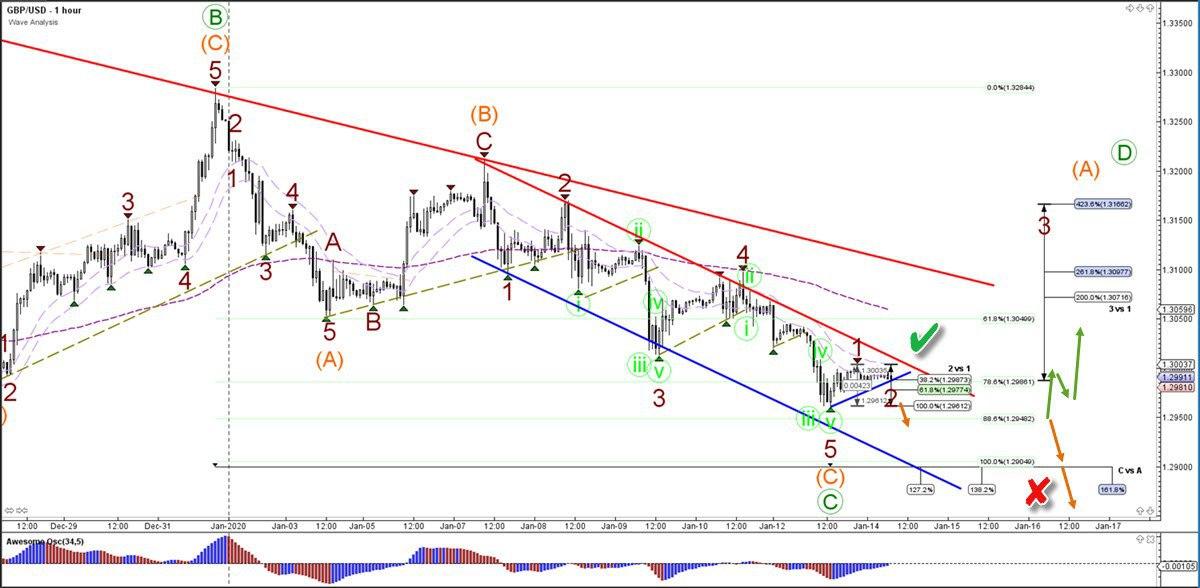
the GBP/USD is testing the Fibonacci retracement support levels of wave C, which is a key decision zone for a bullish reversal or bearish breakout.
GBP/USD
4 hour
The GBP/USD breakout below the 100% Fibonacci level and bottom of wave A (green) invalidates (red x) the expected triangle chart pattern and could indicate a bearish ABC zigzag pattern. A bullish bounce, however, could confirm (green check) the triangle and indicate a 3 wave up within the expected wave D (green).

1 hour
The GBP/USD needs to stay above the 88.6% Fibonacci retracement level to keep the triangle pattern as the most likely scenario. A break below the 88.6% Fib makes the triangle less likely and a push below the 100% level fully invalidates it. A bullish ABC (orange) pattern could take place within wave D (green).
The analysis has been done with SWAT method (simple wave analysis and trading).
For more daily technical and wave analysis and updates, sign-up up to our newsletter.
Good trading,
Chris Svorcik
Elite CurrenSea


Leave a Reply