❗️ GBP/USD Remains Bullish After Bounce at 38.2% Fib ❗️
Subscribe
Hi traders,
the GBP/USD made a strong bullish bounce at the support trend line (green) and is now testing the resistance zone (red). A bullish breakout could see price move higher towards the Fibonacci retracement levels of wave 4 vs 3. Ps. do not forget to check out our upcoming 3x Forex seminars on trading in Europe!
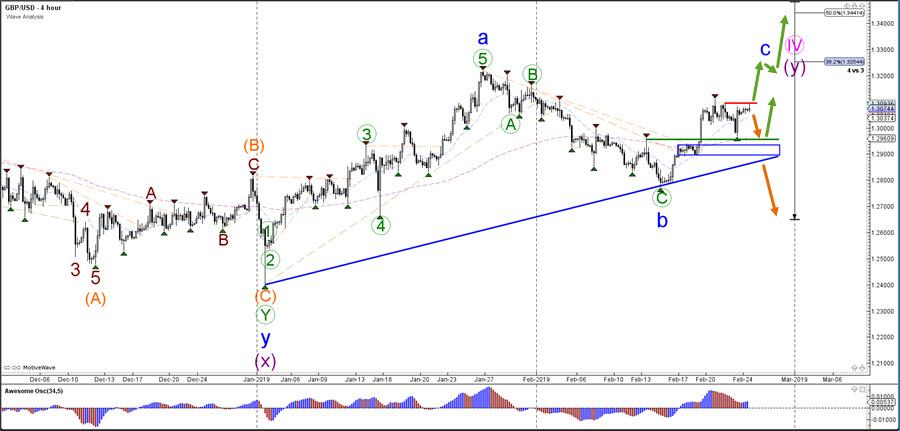
GBP/USD
4 hour
A GBP/USD retracement could see price retest the support zone, which could be a bouncing spot for an upside as well. The bullish view is invalidated if price is able to break below all of the support zones. In that case a larger bearish correction is taking place.
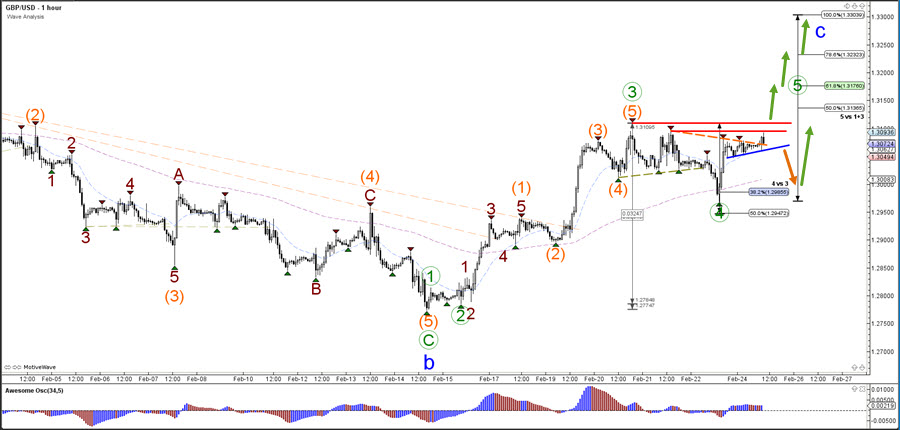
1 hour
The GBP/USD most likely completed a wave 4 (green) at the 38.2% Fibonacci retracement level. This is way for the moment the GBP/USD is either expecting a bullish breakout as part of wave 5 (green) of wave C (blue) or a bearish retracement to test the support zone again.
For more daily wave analysis and updates, sign-up up to our ecs.LIVE channel.
Good trading,
Chris Svorcik
Elite CurrenSea


Leave a Reply