? GBP/USD Remains Bullish Above 1.30 Support & 50% Fib ?

Dear traders,
the GBP/USD is building a bullish channel after breaking above the resistance line and the moving averages. Can the Cable keep the uptrend going?
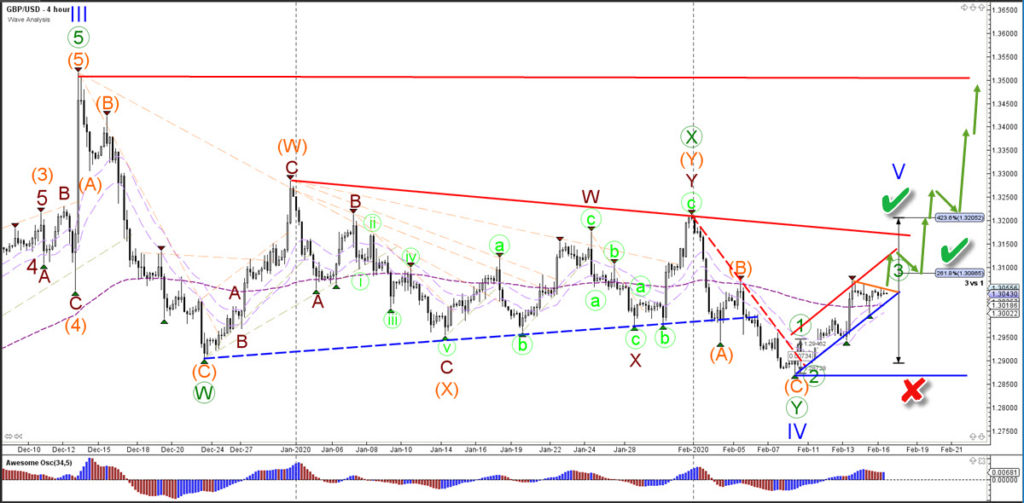
GBP/USD
4 hour
The GBP/USD needs to break above the local resistance line (orange) to confirm the uptrend continuation (green arrows). A break above 1.31 and 1.3250 makes a wave 3 (green) pattern likely (green checks). A push below the bottom invalidates (red x) the bullish wave outlook and indicates a downtrend.
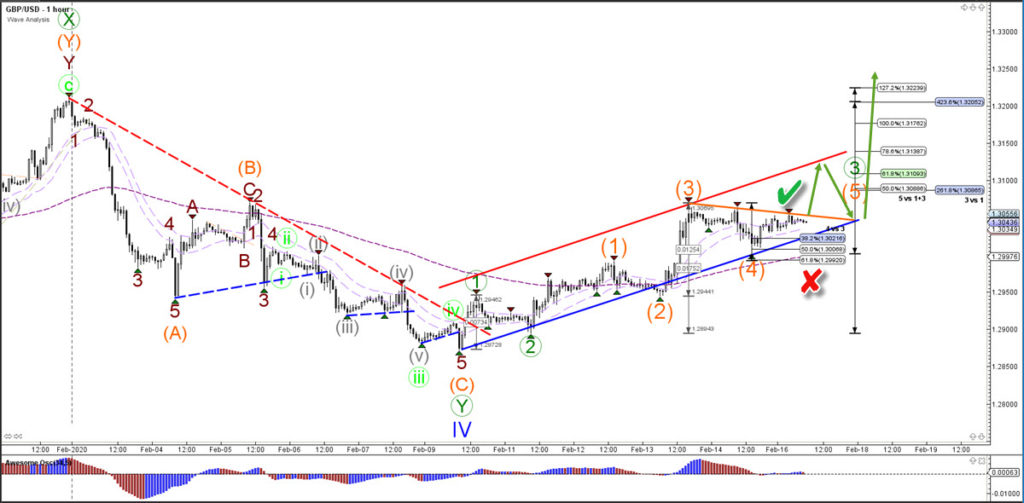
1 hour
The GBP/USD made a bullish bounce at the Fibonacci retracement levels of wave 4 vs 3. This could confirm the wave 4 (orange) retracement. A break above the resistance (orange) indicates a push higher (green check) towards the Fibonacci targets. However, a break below the 61.8% Fib and 144 ema close invalidates (red x) the bullish pattern.
The analysis has been done with SWAT method (simple wave analysis and trading).
For more daily technical and wave analysis and updates, sign-up up to our newsletter.
Good trading,
Chris Svorcik
Elite CurrenSea


Leave a Reply