? GBP/USD Downtrend Aims for Fib Target at 1.25 ?

Dear traders,
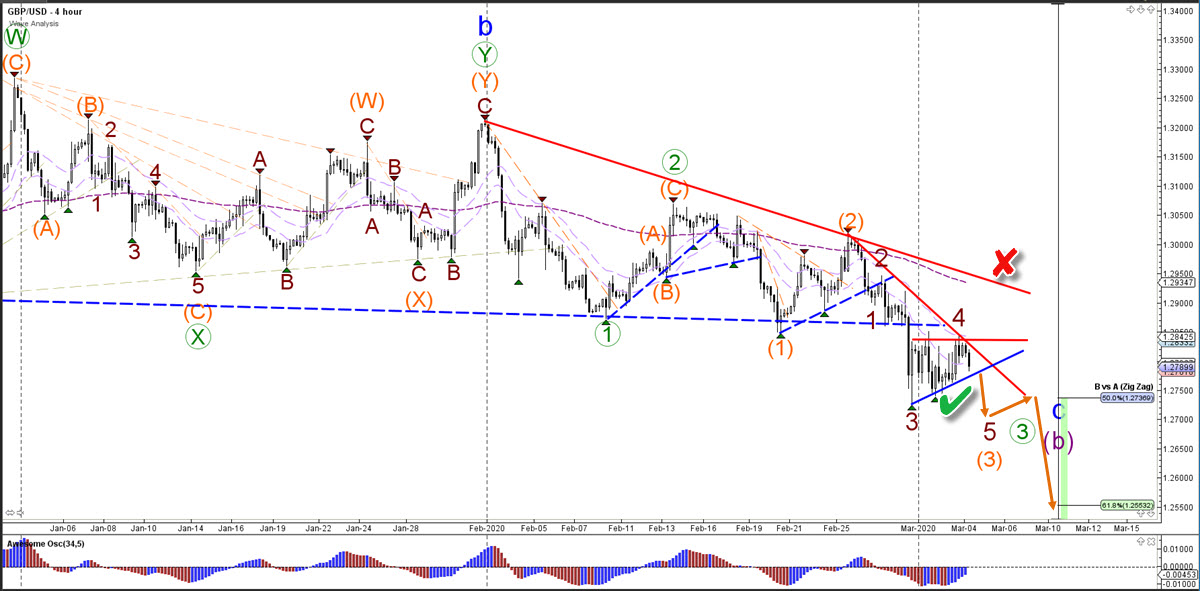
the GBP/USD is building a solid downtrend after breaking the key support zone (dotted blues) at 1.29-1.30. More downside is expected.
GBP/USD
4 hour
The GBP/USD could be in a bearish wave C (blue) of a larger wave B (purple). The bearish breakout is probably a wave 3 (dark red). The current pullback is likely a shallow wave 4 (dark red). The next breakout below the support line (blue) could confirm (green check) the bearish continuation in the wave 3 patterns.
1 hour
The GBP/USD completed a potential ABC (green) pattern within wave 4 (dark red) at the 50-61.8% Fibonacci resistance zone. The bearish breakout is aiming for the Fibonacci targets of wave 3 vs 1. An unexpected break above the resistance invalidates (red x) this bearish outlook.

The analysis has been done with SWAT method (simple wave analysis and trading).
For more daily technical and wave analysis and updates, sign-up up to our newsletter.
Good trading,
Chris Svorcik
Elite CurrenSea


Leave a Reply