? GBP/USD Decision Zone at 61.8% Fibonacci Support Near 1.22 ?
Subscribe
Hi traders,
the GBP/USD price action remains choppy and corrective but a double bottom pattern at the 61.8% Fibonacci retracement level indicates a decision spot for a reversal or breakout.
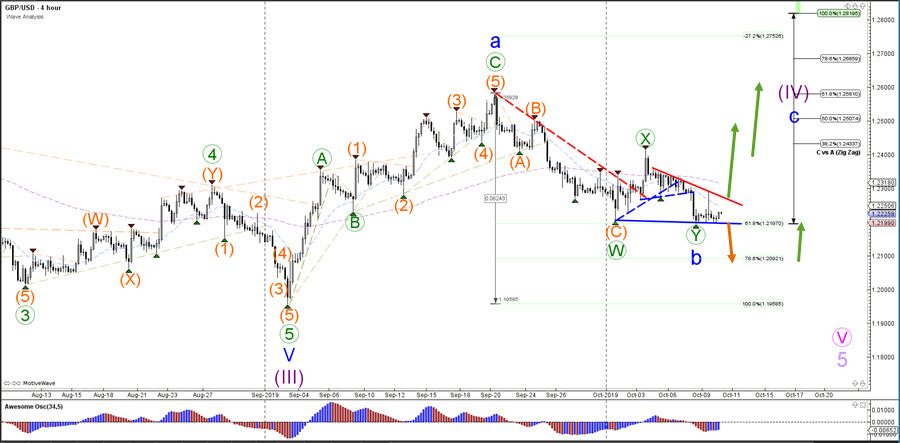
GBP/USD
4 hour
The GBP/USD needs to break above the resistance trend line (red) for a bullish breakout and potential continuation of the wave C (blue). A break below the support trend line (blue) indicates a deeper correction within the wave B (blue) pattern.
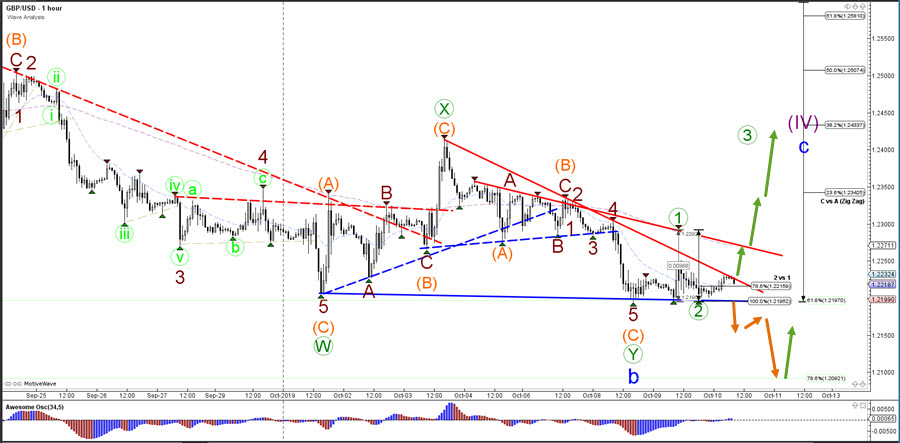
1 hour
The GBP/USD bearish decline failed to break the 61.8% Fibonacci support level, which therefore could potentially complete a wave B (blue). But price will need to stay above previous bottom if the current wave 1-2 (green) pattern is able to hold. Otherwise a deeper retracement in wave B (blue) will take place towards the 78.6% Fibonacci retracement.
For more daily wave analysis and updates, sign-up up to our ecs.LIVE channel.
Good trading,
Chris Svorcik
Elite CurrenSea


Leave a Reply