〽️ GBP/USD Creates Falling Wedge at Golden Ratio (61.8% Fib) 〽️
Subscribe
Hi traders,
The GBP/USD is building a bearish corrective pattern, which seems to be a falling wedge reversal chart pattern. The pattern is a key decision zone: the GBP/USD bullish break could indeed confirm a reversal whereas a bearish break would indicate a potential downtrend.
GBP/USD
4 hour
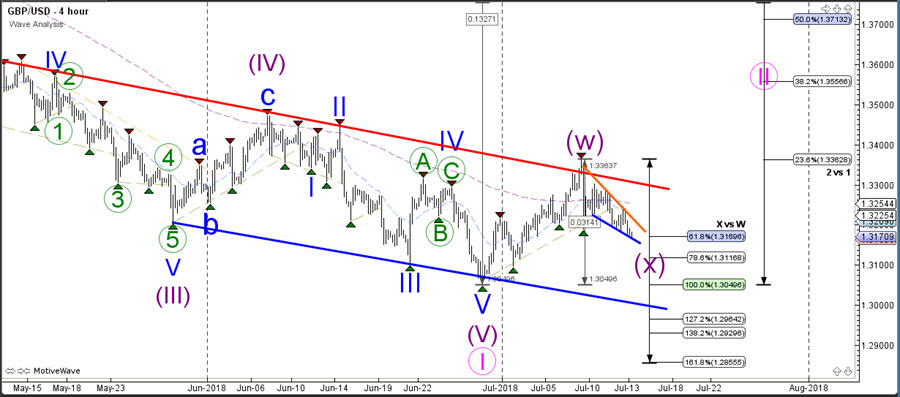
Price is now testing the 61.8% Fibonacci support zone. A bullish break above the bearish trend channel could indicate the start of a wave 2 correction (pink).
1 hour
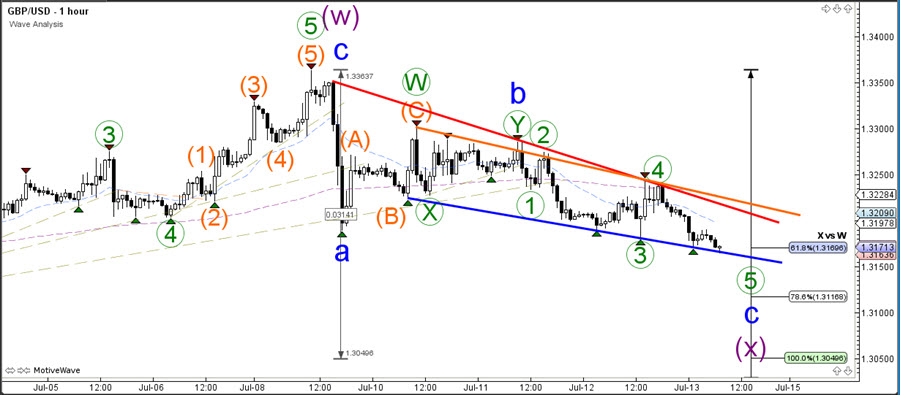
The GBP/USD seems to be building a bearish wave 5 (green) within wave C (blue) after bouncing at the resistance trend line (red). The wave 4 entered into the price territory by a few pips but this is possible in highly leveraged financial markets such as Forex. A bearish breakout below the support trend line (blue) could see price lower towards the next Fib targets whereas a bullish breakout could send price higher and confirm a reversal.
Good trading,
Chris Svorcik
Elite CurrenSea


Leave a Reply