☝️ GBP/USD Bullish Reversal Aims at 1.25 and 61.8% Fib ☝️

Dear traders,
the GBP/USD was unable to break below the support zone and made a bullish breakout above the resistance line instead. What’s next for the Cable?
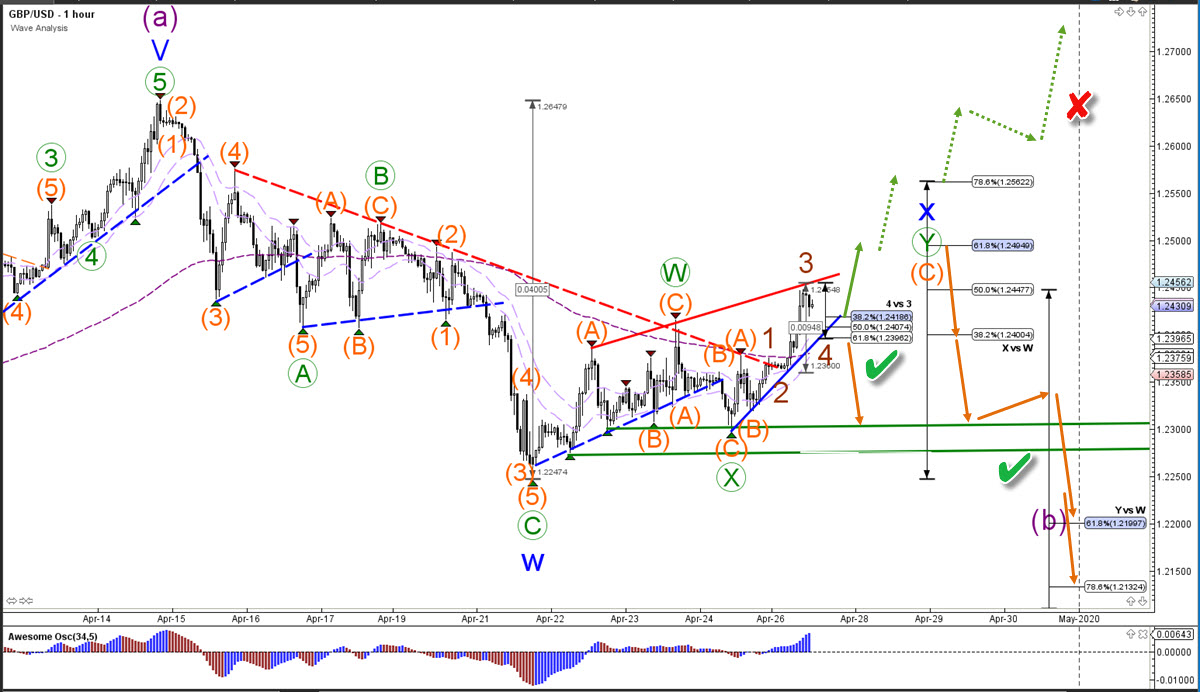
GBP/USD
1 hour chart
The GBP/USD made a bearish ABC (orange) pattern within the wave X (green), which indicates a more complex WXY (green) correction. Within the wave Y (green), price seems to be building an ABC (orange) pattern. Currently, price could be in a wave 3-4 (brown) as long as price respects the Fibonacci levels of wave 4 vs 3. The main target is the 61.8% Fib at 1.25.
A break above the 1.25 round level would indicate a turn of events and the bulls would be regaining control. This is especially true if a corrective pattern is visible after strong bullish momentum, which would make a reversal more likely.
The analysis has been done with SWAT method (simple wave analysis and trading).
For more daily technical and wave analysis and updates, sign-up up to our newsletter.
Good trading,
Chris Svorcik
Elite CurrenSea


Leave a Reply