? GBP/USD Bullish Breakout Starts Bullish Wave 3 ?
July 23, 2018
2 min read
Subscribe
Hi traders,
The GBP/USD made a bullish reversal at the support line (blue) of the downtrend channel. The failure to break below the channel confirms that a bullish correction is more likely than a bearish trend.
GBP/USD
4 hour
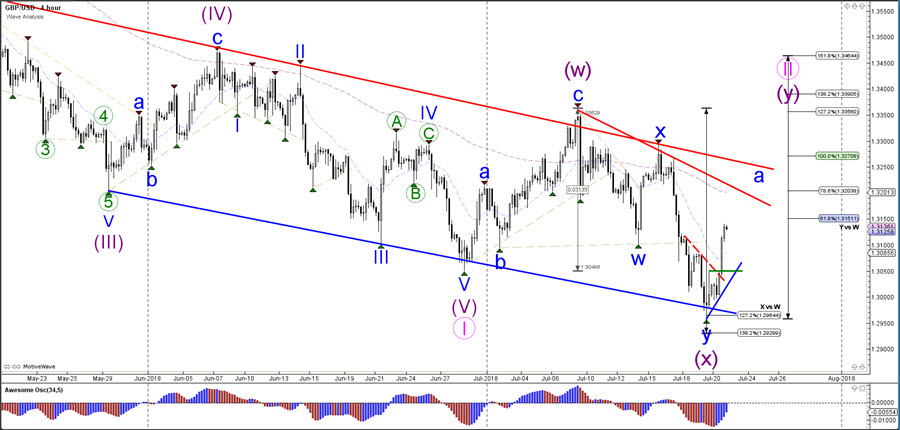
The GBP/USD bullish momentum is probably a wave A (blue) of a larger ABC zigzag pattern.
1 hour

The GBP/USD seems to be building a 5 wave (green) pattern within wave A (blue). An immediate bullish breakout could be part of wave 3 (green) whereas a mild and corrective wave 4 (green) could see a light pullback back to the Fibonacci levels of wave 4 (green). A break below the support trend lines and 61.8% Fib could indicate a bullish ABC rather than 123.
Good trading,
Chris Svorcik
Elite CurrenSea


Leave a Reply