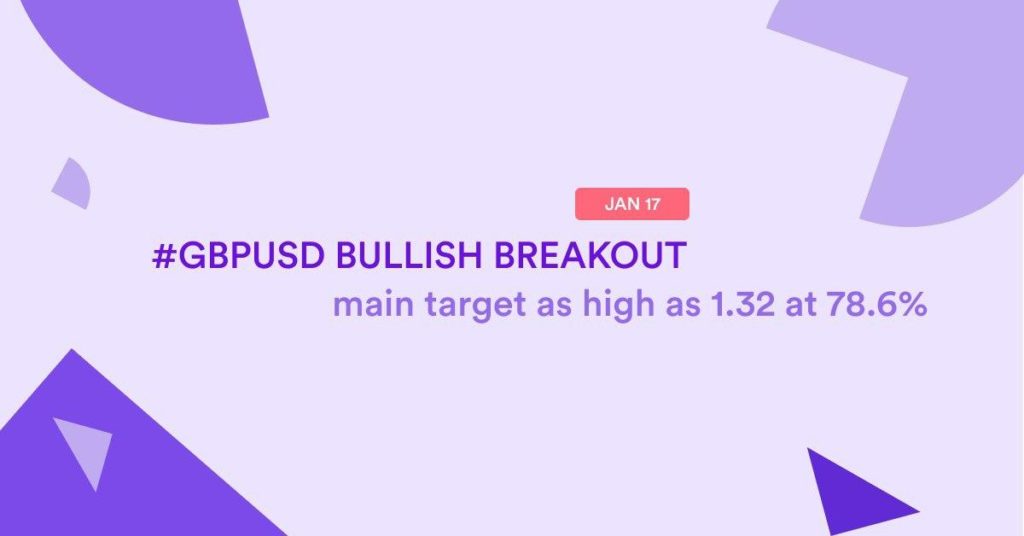
? GBP/USD Bullish ABC Zigzag Pattern in Contracting Triangle ?

Dear traders,
the GBP/USD showed a bullish bounce at the 88.6% Fibonacci retracement level and also made a bullish breakout above the resistance trend line (dotted red).
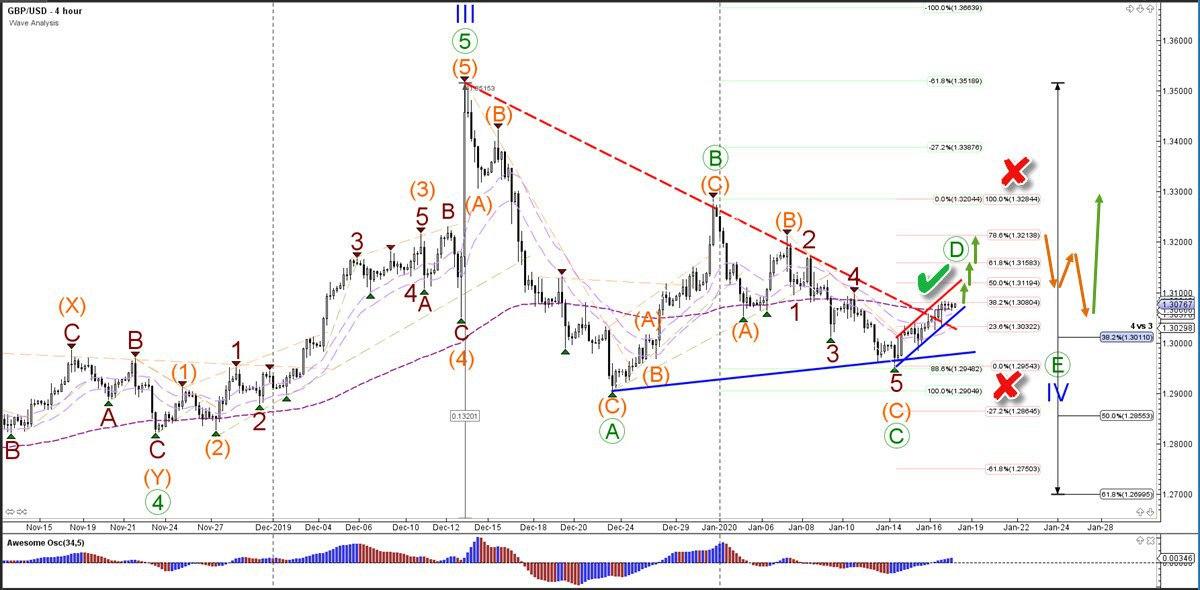
GBP/USD
4 hour
The GBP/USD bullish price swing could be part of a larger ABCDE (green) triangle pattern. The current bullish swing is likely a wave D (green) as long as the price stays below the top of 1.3280 or above the bottom of 1.2950 (red x). A bullish breakout (green check) above the 38.2% Fibonacci level could indicate a move higher towards the Fibonacci targets.
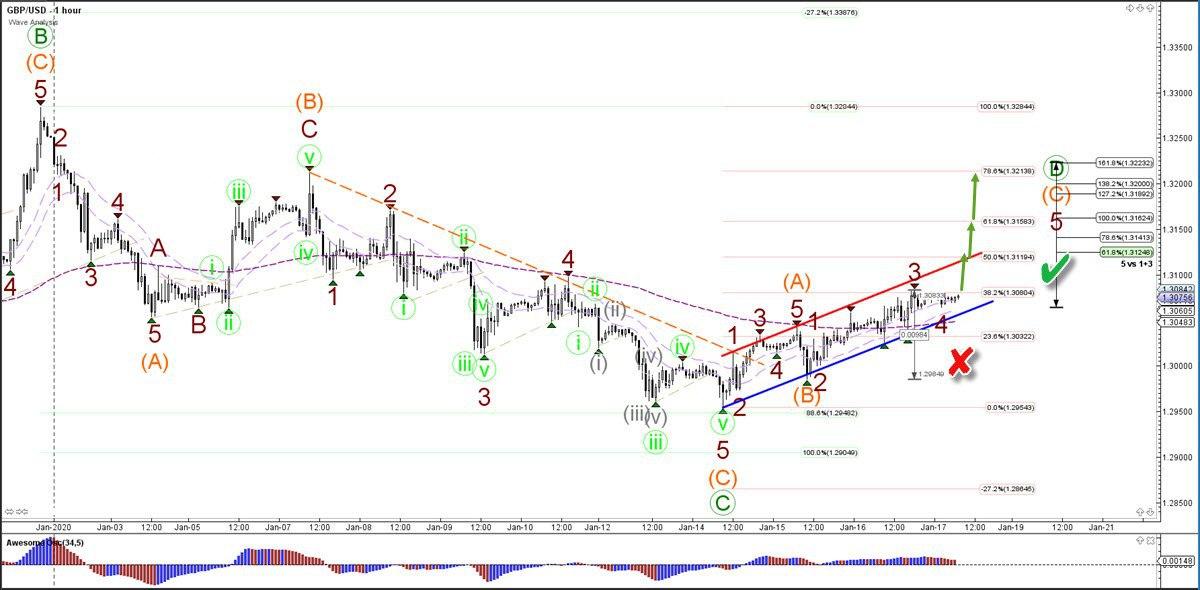
1 hour
The GBP/USD is building a 5 wave (dark red) within a potential wave C (orange). The bullish breakout above the 38.2% Fib could confirm the continuation whereas a break below the 1.30 support zone could indicate the end of the ABC (orange) pattern and a bearish breakout.
The analysis has been done with SWAT method (simple wave analysis and trading).
For more daily technical and wave analysis and updates, sign-up up to our newsletter.
Good trading,
Chris Svorcik
Elite CurrenSea


Leave a Reply