? GBP/USD Breaks Triangle and Bearish Impulse Aims at 1.23 ?
Subscribe
Hi traders,
the GBP/USD downtrend is showing strong signs of continuation after it break the support trend line (dotted blue) of the contracting triangle pattern. How far can the GBP/USD fall before the interest rate, policy statement and press conference from the Bank of England on Thursday 1 of August?
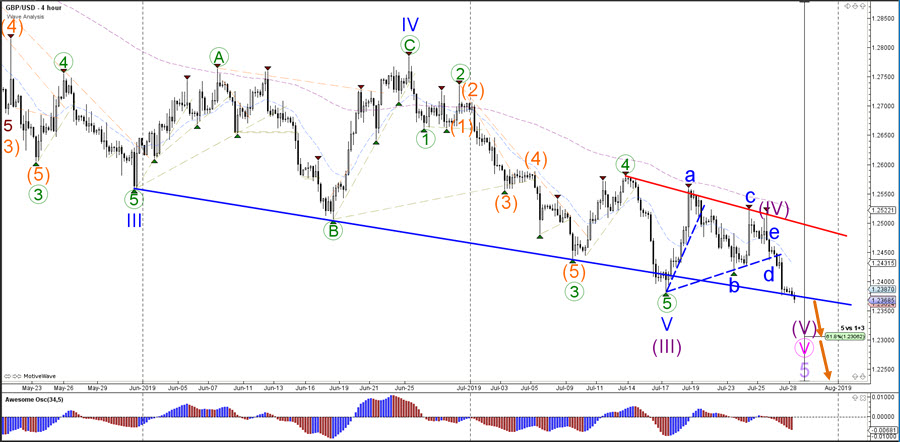
GBP/USD
4 hour
The GBP/USD completed ABCDE (blue) price swings within a wave 4 (purple) triangle pattern. The bearish breakout indicates a continuation towards the 61.8% Fibonacci target for the moment at 1.23-1.2250. Later on, price could retest the previous bottom and low of the last decades on the monthly chart at 1.20.
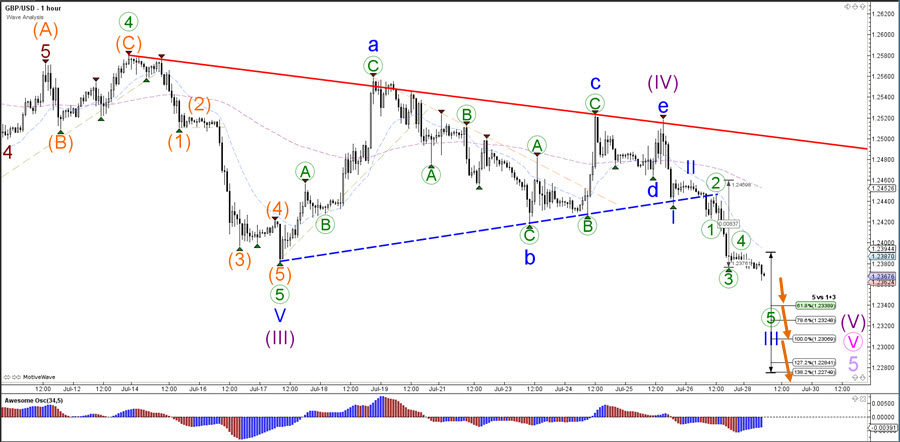
1 hour
The GBP/USD could be in a wave 3 (blue) impulse at the moment. The main targets of the wave 5 (green) of wave 3 (blue) are the Fibonacci levels of wave 5 vs 1+3. Once price completes a wave 3 (blue), then a retracement within wave 4 is expected.
For more daily wave analysis and updates, sign-up up to our ecs.LIVE channel.
Good trading,
Chris Svorcik
Elite CurrenSea


Leave a Reply