? GBP/USD Bears Regain Control and Aim at 1.2175 Target ?

Dear traders,
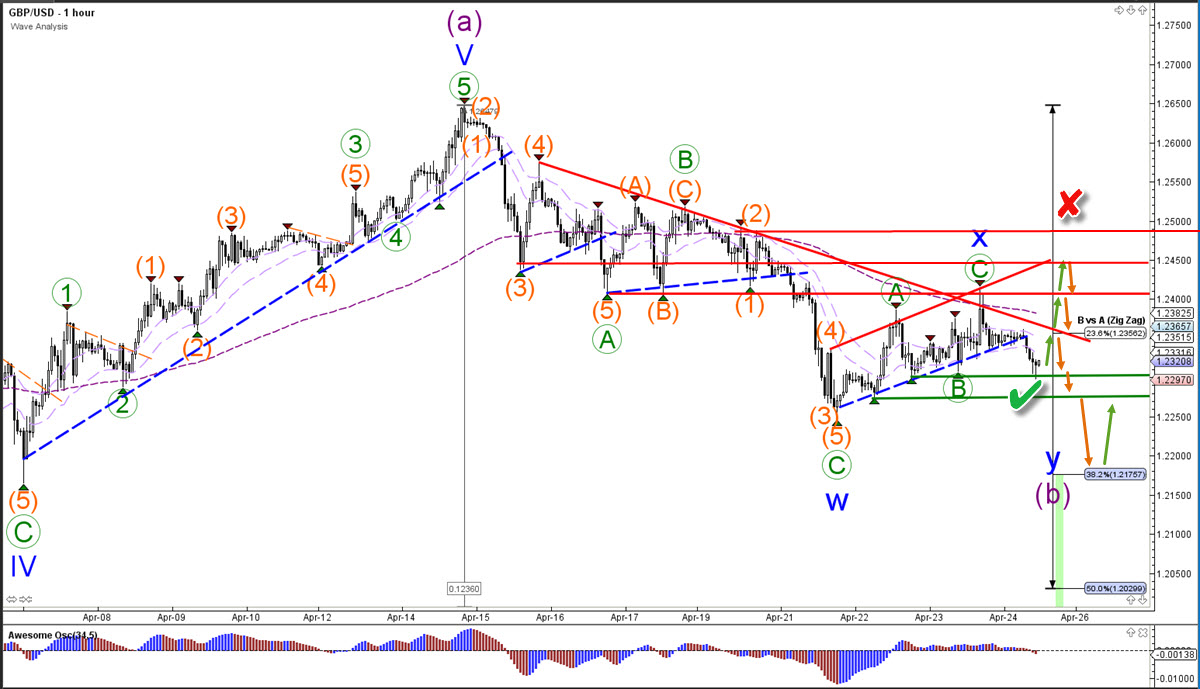
the GBP/USD has completed a bearish ABC pattern after 5 waves (blue up). But the bearish retracement is expected to expand into a larger WXY.
GBP/USD
1 hour chart
The GBP/USD is now breaking the support trend line (dotted blue). Price will also need to break below the local horizontal support (green lines) before a clear breakout can be expected. The main target is the 38.2% Fibonacci retracement level of wave B vs A, although price action can even extend its bearishness towards the 50% Fib.
A bullish bounce at support could occur as well. In that case, price will retest the resistance levels first. They are likely to act as a bearish bouncing spot. Only if price is above the break above 1.25 would the current bearish outlook become less likely (red x).
The analysis has been done with SWAT method (simple wave analysis and trading).
For more daily technical and wave analysis and updates, sign-up up to our newsletter.
Good trading,
Chris Svorcik
Elite CurrenSea


Leave a Reply