? GBP/USD Bearish Retrace Losing Steam at 78.6% Fib at 1.28 ?

Dear traders,
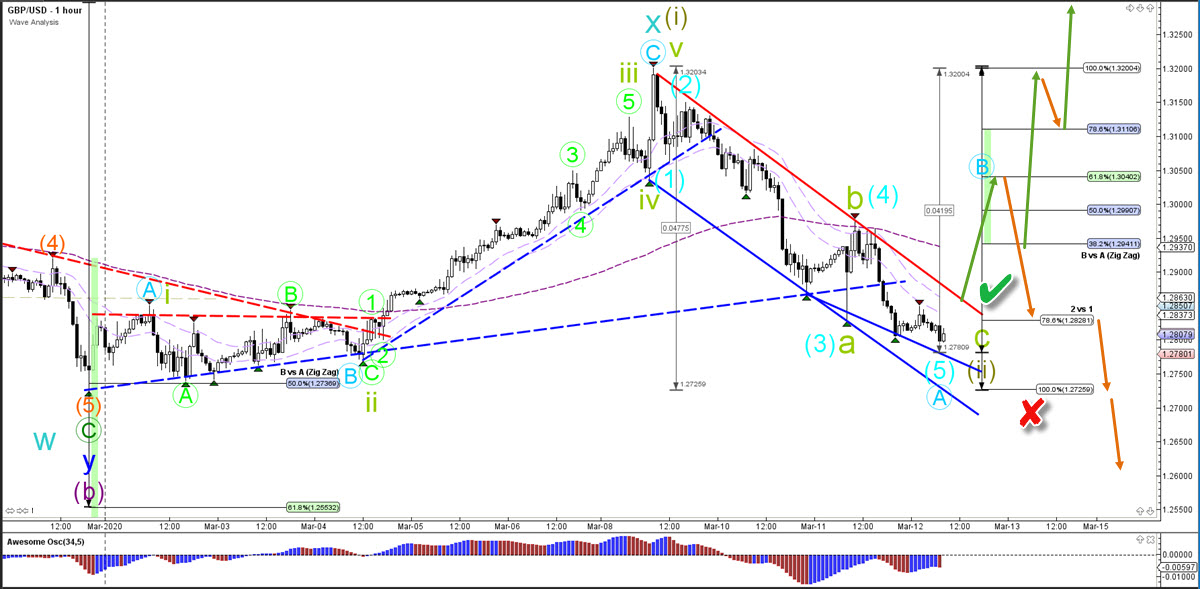
the GBP/USD is building a downtrend channel. But price action is now back at a key support zone. Will price action make a bullish bounce or bearish break?
GBP/USD
1 hour
The GBP/USD chart shows 2 different wave outlooks: a bullish scenario in green and a bearish one in blue. It is unclear which pattern has a better chance. A bullish bounce seems likely in both cases – either for a wave B (blue) or for the start of the wave 3 after finishing wave 1-2 (green). A break below the bottom invalidates (red x) the wave 2 (green). A break above the trend line (red) confirms (green check) the breakout.
1 minutes
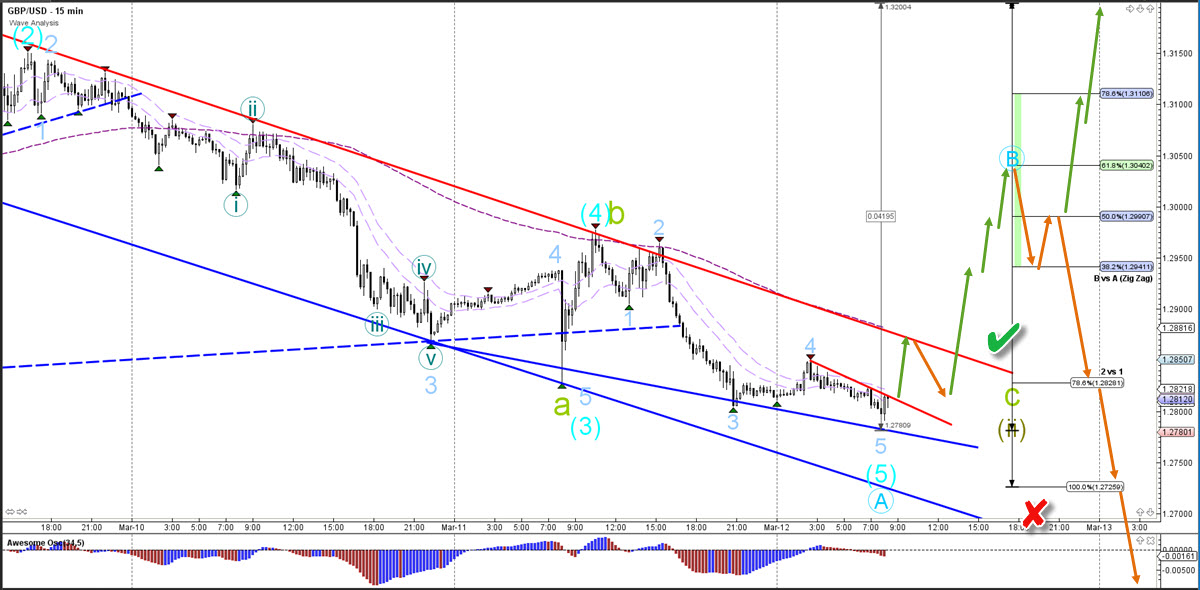
The GBP/USD seems to have completed the bearish swing. Either via an ABC (green) of wave 2 (green). Or of wave 5 (blue) of wave A (blue). Price needs to break above the resistance trend lines (red) for a rally higher.
The analysis has been done with SWAT method (simple wave analysis and trading).
For more daily technical and wave analysis and updates, sign-up up to our newsletter.
Good trading,
Chris Svorcik
Elite CurrenSea


Leave a Reply