? GBP/USD Bearish ABC Pullback within Wave 4 Pattern ?

Dear traders,
the GBP/USD is building a bearish retracement within the long-term uptrend. When is the Cable ready for a bullish continuation?
GBP/USD
Price Charts and Technical Analysis
The GBP/USD is building an ABC (pink) correction. The current swing up could be part of a wave B. This means that another bearish swing for wave C is possible. The main target is the 38.2% Fibonacci retracement, the -61.8% Fib target, and the 144 ema close (blue box) at the round level of 1.30.
This support zone (blue box) could complete the wave 4 (purple) and start a new uptrend. A break below the 50% Fib however invalidates (red x) the bullish outlook. Alternatively, a break, pullback and bounce above the 21 ema zone could indicate a bullish swing without a deeper retracement.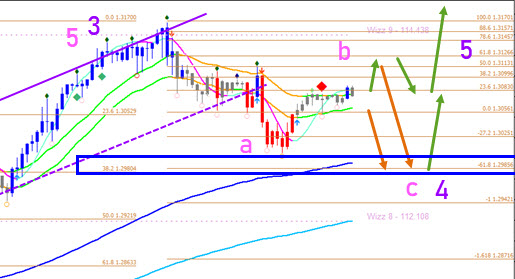
The analysis has been done with SWAT method (simple wave analysis and trading).
For more daily technical and wave analysis and updates, sign-up up to our newsletter.
Good trading,
Chris Svorcik
Elite CurrenSea


Leave a Reply