〽️ GBP/USD Bear Flag Pattern in Wave-4 and Downtrend 〽️
Subscribe
Hi traders,
The GBP/USD seems to be building a consolidation pattern which is typical for a wave 4 (blue), as long as price stays below the 50% Fibonacci level of wave 4 vs 3. A bearish continuation seems therefore likely.
GBP/USD
4 hour
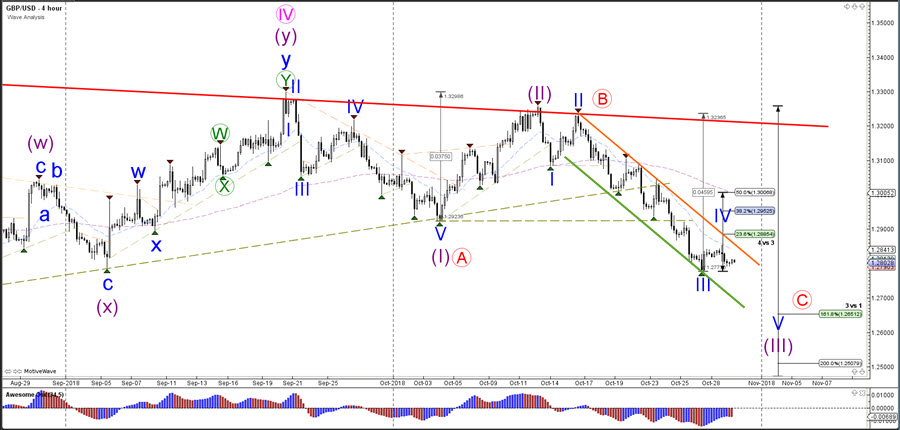
The GBP/USD is in a bearish downtrend channel and a continuation could aim for the Fibonacci targets of wave 3 vs 1. A bullish break above the 50% Fibonacci retracement level however makes a wave 4 pattern less likely and could indicate that price is making an ABC pattern (red) rather than a 123.
1 hour
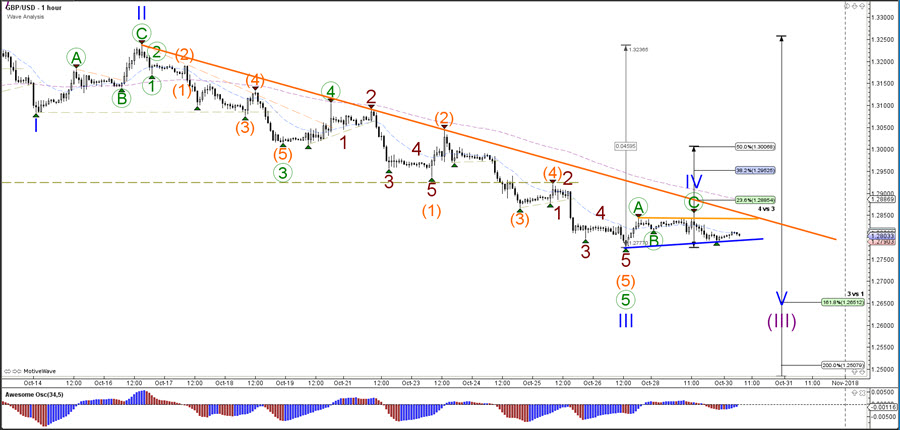
The GBP/USD seems to have completed a simple ABC correction (green) within wave 4 (blue). The support trend line (blue) of the bear flag chart pattern is the main indicator to watch. A bearish break below the support could indicate a continuation of the downtrend whereas a bounce could indicate a larger bear flag or retracement to the Fib levels.
For more daily wave analysis and updates, sign-up up to our ecs.LIVE channel.
Good trading,
Chris Svorcik
Elite CurrenSea


Leave a Reply