✅ GBP/USD Awaits Break of Bull Flag Chart Pattern ✅
Subscribe
Hi traders,
the GBP/USD is building a bull flag chart pattern within a larger uptrend. A bullish breakout above the resistance (red) line of the bull flag could indicate a continuation towards the top of the uptrend channel and the Fibonacci targets. Check out for regular ecs.LIVE updates, webinars, analysis and setups in the Forex market.
GBP/USD
4 hour
The GBP/USD uptrend is approaching a key 50% Fibonacci retracement level of wave 4 (pink), which is a major decision zone for a bullish break or bearish bounce. A break below the support (blue) line of the bullish channel could indicate the end of the uptrend and start of a potential downtrend.

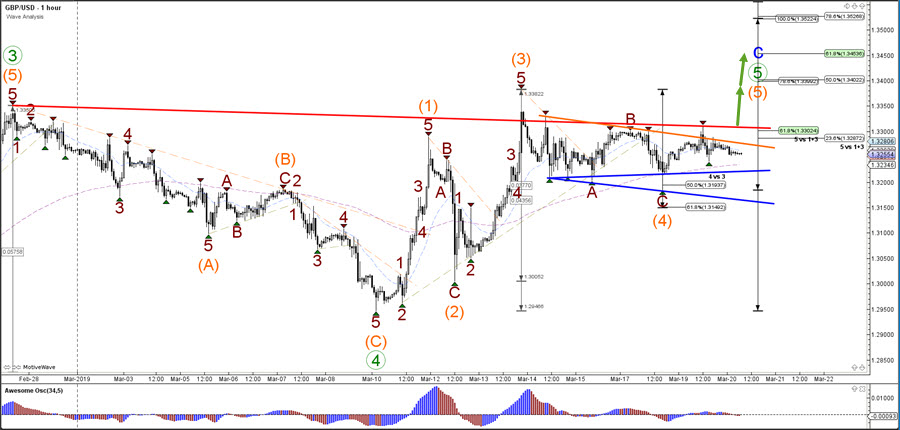
1 hour
The GBP/USD is trying to break above the resistance trend lines (orage/red) but so far has failed to push above the bull flag chart pattern. Price will need to break above 1.33 before upside becomes more likely whereas a break below the support trend lines (blue) indicates an invalidation of the bull flag chart pattern.
For more daily wave analysis and updates, sign-up up to our ecs.LIVE channel.
Good trading,
Chris Svorcik
Elite CurrenSea


Leave a Reply