? GBP/USD Ascending Wedge Pattern Ready to Break 1.2750 ?

Dear traders,
the GBP/USD is finding support at the trend lines and 144 ema close. The bulls remain in control but a break above the Wizz 7 level remains critical.
GBP/USD
1 hour chart
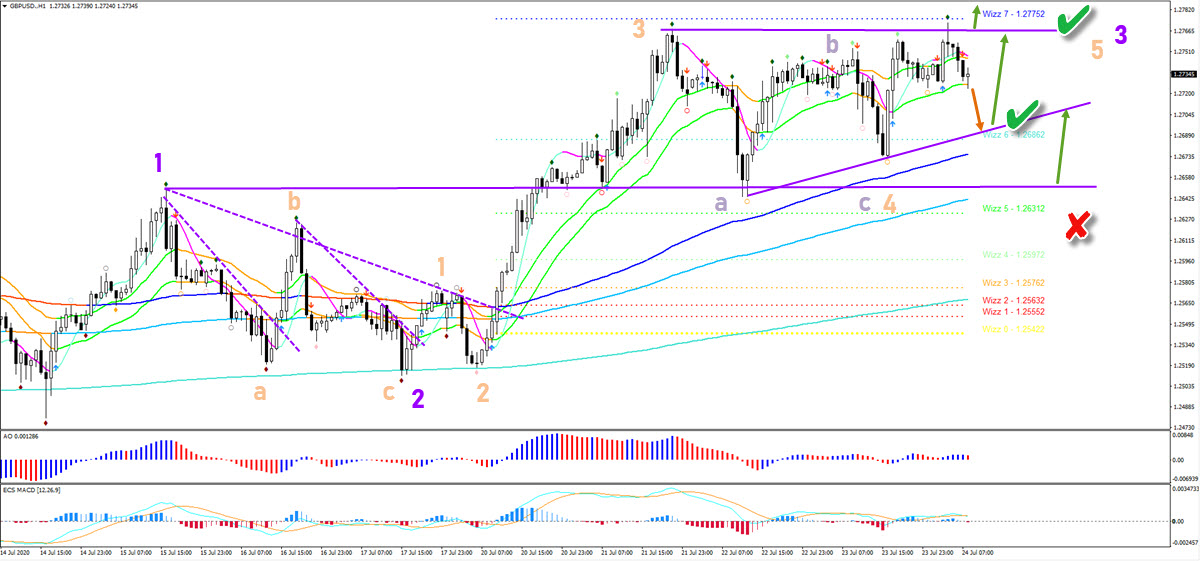
The GBP/USD bullish breakout needs a candle close above 1.2775 to confirm the upside. But also a bounce at support could take place again before the uptrend continues. The main target of a breakout is aiming at Wizz 8 level at 1.2920. The current chart pattern resembles an ascending wedge pattern, which is a bullish formation. A break below at 1.2650 makes the bullish outlook less likely (red x).
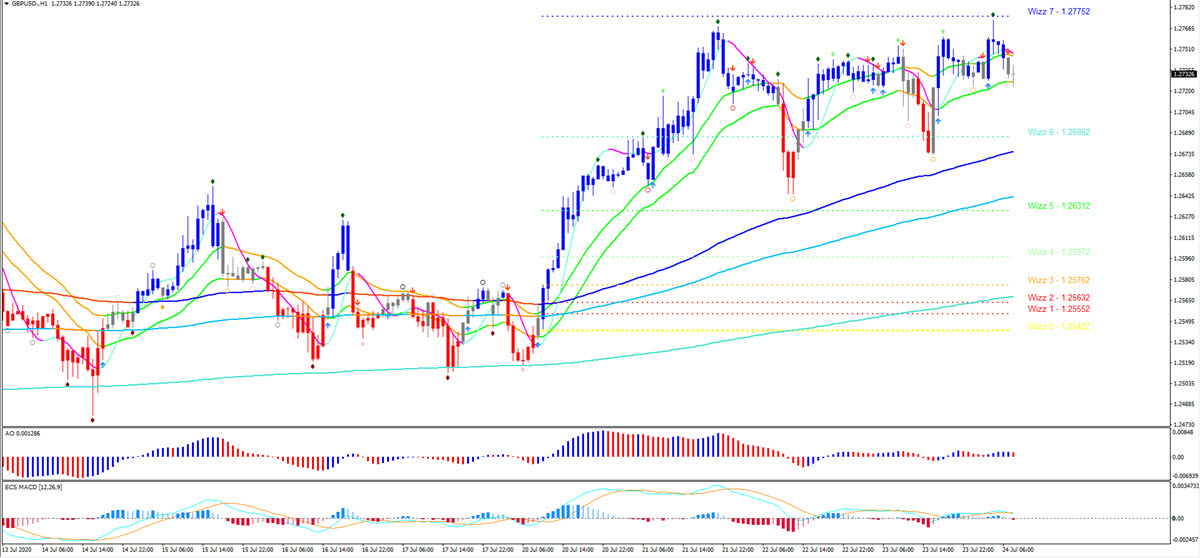
The GBP/USD seems to have completed a strong bullish wave 3 (orange). The current pullback is acting as an expected wave 4 (orange) with an ABC (purple). The push up could be a wave 5 of wave 3. Spotting the wave patterns becomes easier when using the moving averages (see image below where you can see ecs.SWAT candles based on the 34 emas).
The analysis has been done with SWAT method (simple wave analysis and trading).
For more daily technical and wave analysis and updates, sign-up up to our newsletter.
Good trading,
Chris Svorcik
Elite CurrenSea


Leave a Reply