? GBP/USD Aims at 1.20 Target After Breakout ?


Dear traders,
the GBP/USD is in a clear downtrend. But price will first need to break the support zone (green line)… Otherwise there is a risk of a deeper pullback towards the 50% Fibonacci resistance. Let’s review.
GBP/USD
1 hour chart
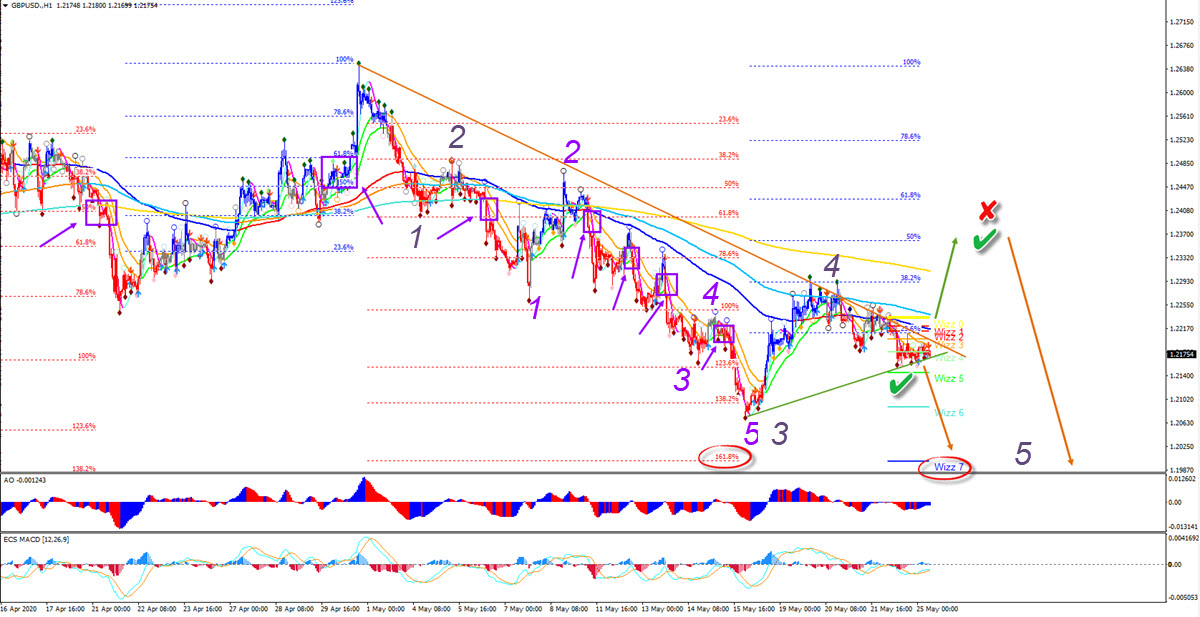
The GBP/USD bearish breakout would confirm (green check) the downtrend continuation. The bearish trend looks strong when considering the Moving Averages (MA). They are fully aligned to the downside. Plus price action made a bearish bounce at the 144-233 MA resistance zone. The target of the bearish break is aiming at the round 1.20 level. There is a confluence of Wizz 7 and 161.8% Fibonacci target (red circles).
If price action, however, breaks above the resistance line (orange), then a deeper retracement towards the 50% Fibonacci level is expected. The 50% Fib is expected to be a bouncing spot for more downside (orange arrow). A break above the 50% Fib makes the bearish outlook unlikely (red x).

The analysis has been done with SWAT method (simple wave analysis and trading).
For more daily technical and wave analysis and updates, sign-up up to our newsletter.
Good trading,
Chris Svorcik
Elite CurrenSea


Leave a Reply