? GBP/JPY Weekly Bullish Breakout Signals Target at 155 ?


Dear traders,
the GBP/JPY is breaking above the key resistance trend line (dotted purple). This occurred after a double bottom around the 125 support. Can the GJ now test the previous top?
GBP/JPY
Price Charts and Technical Analysis
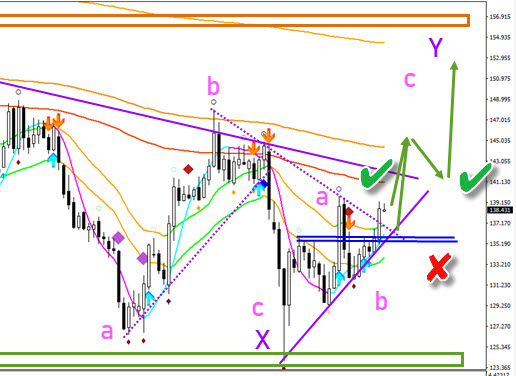
The GBP/JPY seems ready for a bullish wave C (pink) due to the break above the 21 ema zone and resistance trend line. But the long-term MAs remain bearish. A new break is needed before a full upswing can be confirmed. A bullish break, flag, and continuation would confirm that upside (green checks). The main target could be 155 at the previous top.
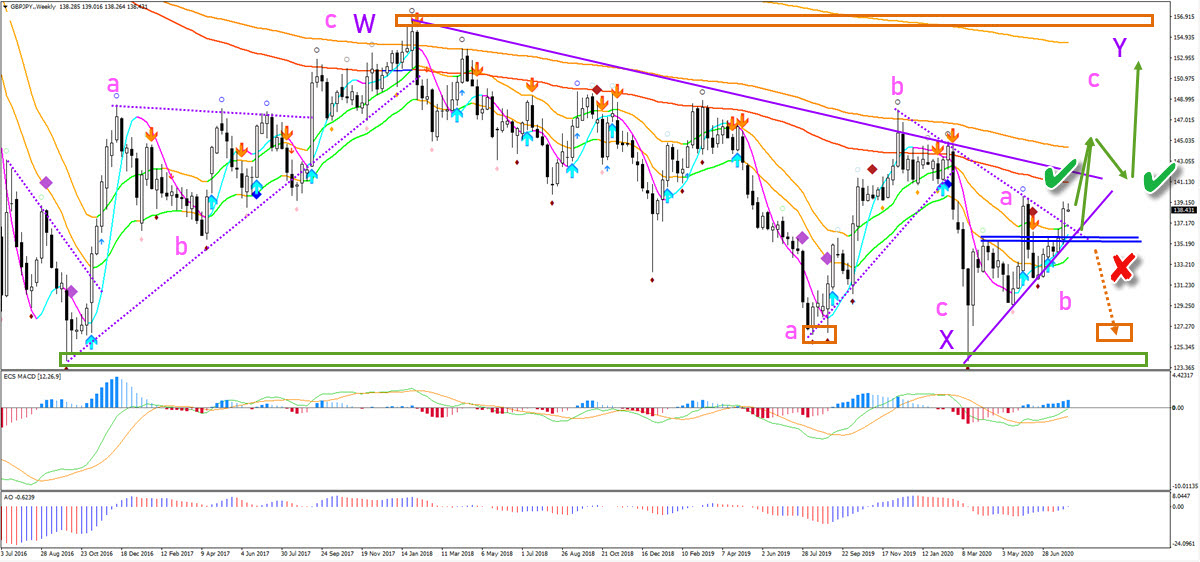
Price action should remain last week’s candle low and overall support zone (blue lines). A bearish breakout below that support zone invalidates the bullish outlook (red x). A bearish breakout could trigger an unexpected bearish swing (dotted orange arrow). In that case, price could build an inverted head and shoulders pattern.
The analysis has been done with SWAT method (simple wave analysis and trading).
For more daily technical and wave analysis and updates, sign-up up to our newsletter.
Good trading,
Chris Svorcik
Elite CurrenSea


Leave a Reply