☝️ EUR/USD Bullish Break Kick Starts Reversal to 1.13? ☝️

Dear traders,
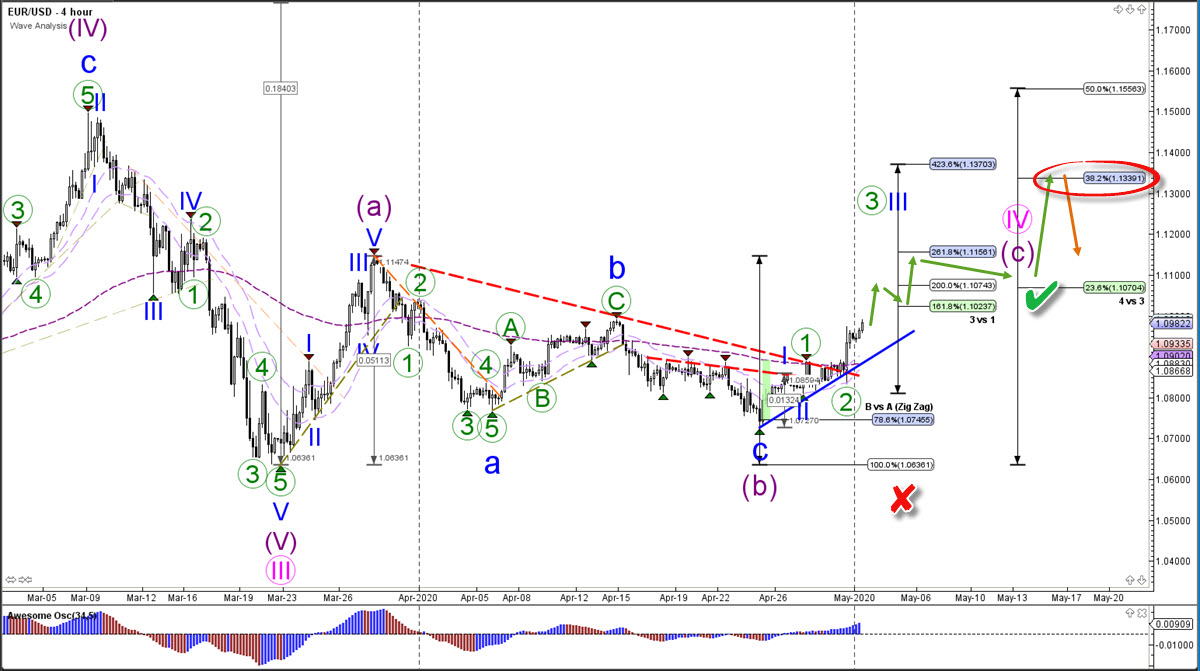
the EUR/USD is breaking the counter trend resistance lines for a potential bullish reversal. The bullish breakout could confirm a wave C (purple).
EUR/USD
4 hour chart
The EUR/USD needs to break above the 1.10 round level to confirm (green check) a larger push up. A break above 1.11 is making it even more likely that the current bullish price swing is a wave 3. The main target could be all the way up at 1.1339, which is the 38.2% Fibonacci retracement level of wave 4 vs 3.
A break below the bottom and 100% Fibonacci level at 1.0636 invalidates (red x) the bullish wave outlook. A break below the 21 ema zone and support trend line (blue) already makes the current impulsive wave 3 (green and blue) unlikely.
The analysis has been done with SWAT method (simple wave analysis and trading).
For more daily technical and wave analysis and updates, sign-up up to our newsletter.
Good trading,
Chris Svorcik
Elite CurrenSea


“A break below the bottom and 100% Fibonacci level at 1.0636 invalidates (red x) the bullish wave outlook”
We will not see this level again (1.0636) or lower for a very long time – until next year.
Bulls have the ball for the rest of the year.