? Bitcoin Bulls Breaks Ascending Wedge Chart Pattern ?


Dear traders,
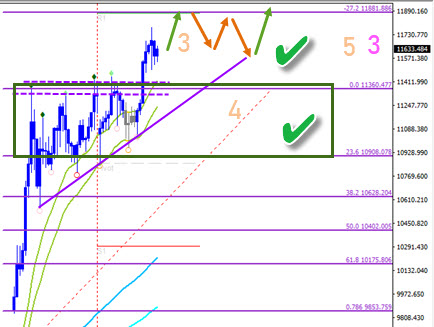
the Bitcoin (BTC/USD) is breaking above the bullish ascending wedge chart pattern. An uptrend continuation is again on track with short-term targets at 11,880 and 12,500.
BTC/USD
Price Charts and Technical Analysis
The BTC/USD bullish burst to the upside after breaking the triangle (dotted purple) is a classical example of a wave 3. The choppy price action after the momentum up always respected the 21 ema zone (as the blue SWAT candles indicate). The bullish breakout is the expected price movement of the chart pattern. Price is now on its way to the -27.2% Fibonacci target at 11,880 but an extension is also possible.
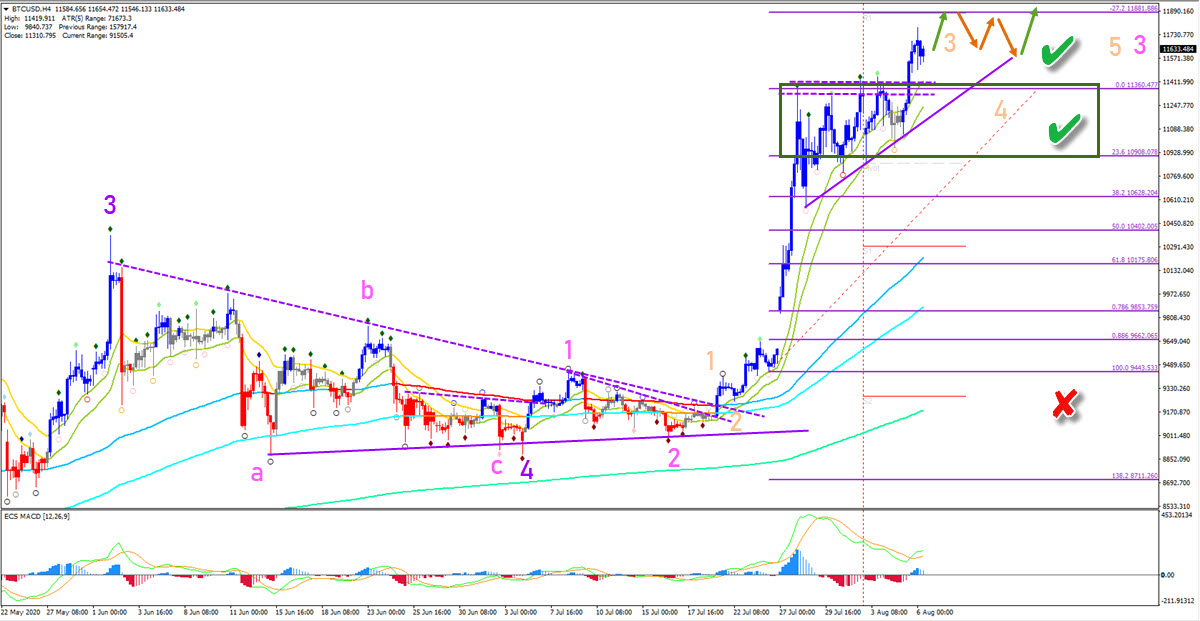
If price action does build any type of pullback, then the support zone (dark green box) is a very strong area. Price is expected to stay above it and use the zone for a bullish bounce. Most likely, any retracement would be shallow and an uptrend continuation is expected. Only a massive and major reversal would invalidate (red x) the current bullishness.
The analysis has been done with SWAT method (simple wave analysis and trading).
For more daily technical and wave analysis and updates, sign-up up to our newsletter.
Good trading,
Chris Svorcik
Elite CurrenSea


Leave a Reply