USD/JPY ? Bounce or Break ? During FOMC
Subscribe
Dear Traders,
The USDJPY is at a critical decision point on the eve of the FOMC meeting.
Will the Dollar make a bullish break of the long-term range or will it fall?
This analysis will take a look at both scenarios.
The long-heralded December FOMC meeting is only a few hours away and all three majors (EUR/USD, GBP/USD, and USD/JPY) are finding themselves at key decision zones.
The outlook for the USDJPY remains quite uncertain; there are price-action signs that could be encouraging for both, bulls and bears.
Bullish Scenario
The 4 hour chart below shows 2 possible wave count scenarios. The bullish version indicates that the high from early November 2017 may have been the end of Wave 1 (red) of a new large uptrend.
Consequently, the downward correction we have seen up until the end of November would form a quite neat Wave 2 (red), with all its internal structure looking very much complete. Price bounced at around 111 and has shown very bullish momentum which could be typical of a Wave 3 (red). The sharp downward spikes within this recent bullish move are also not uncommon at the beginning stages of large Wave 3s.
But price has significantly slowed its upward momentum over the last few days, which either means that we are approaching the later stages of the first part of the new Wave 3 impulse or that we may not be in a new uptrend yet after all…
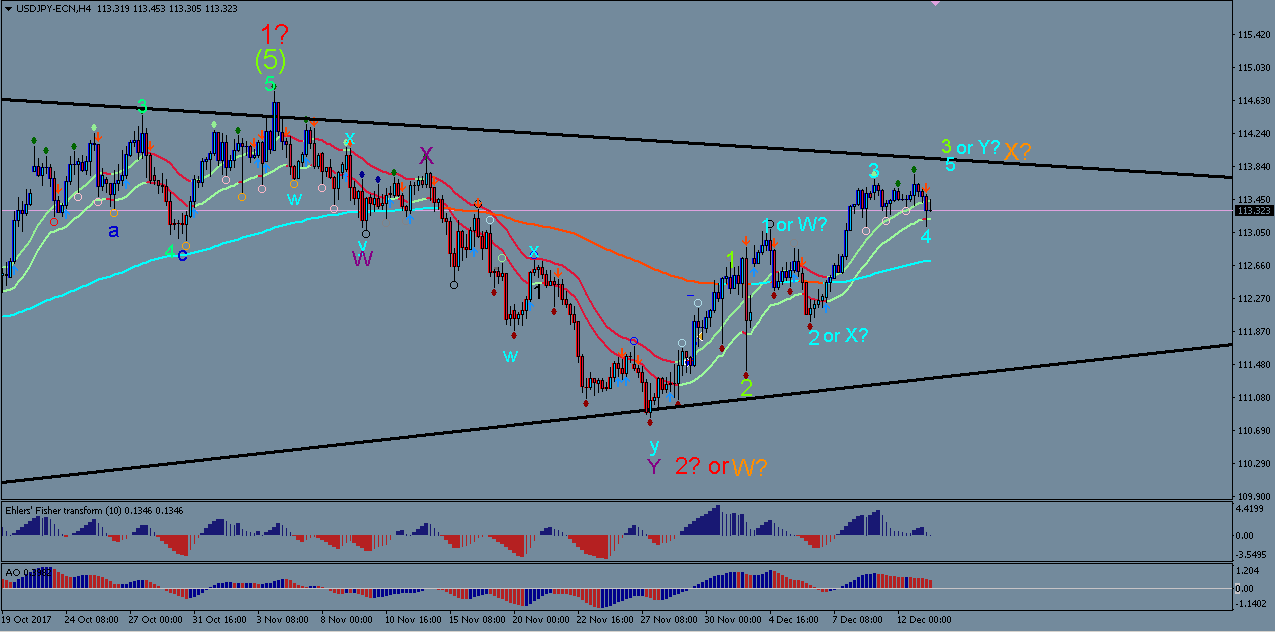
The Bearish Scenario
The bearish wave count alternative shows that price may still find itself within yet another larger corrections. whereby the low of 111 only formed the first swing (orange wave W?) and the bullish trend of the last couple of weeks would therefore correlate with the second swing of the correction (orange wave X?).
The structure for such a scenario is also quite plausible. The sharp downward spikes would then be labelled as reactive ‘x-waves’ within the large orange X.
It all hangs in the balance…
When looking at the USD/JPY from a larger timeframe (see image below), the bullish scenario could perhaps be more likely because price has been in correction for such a long time already and has approached the resistance level of 114.50 so many times before that the likelihood of it breaking is increasing ever more.
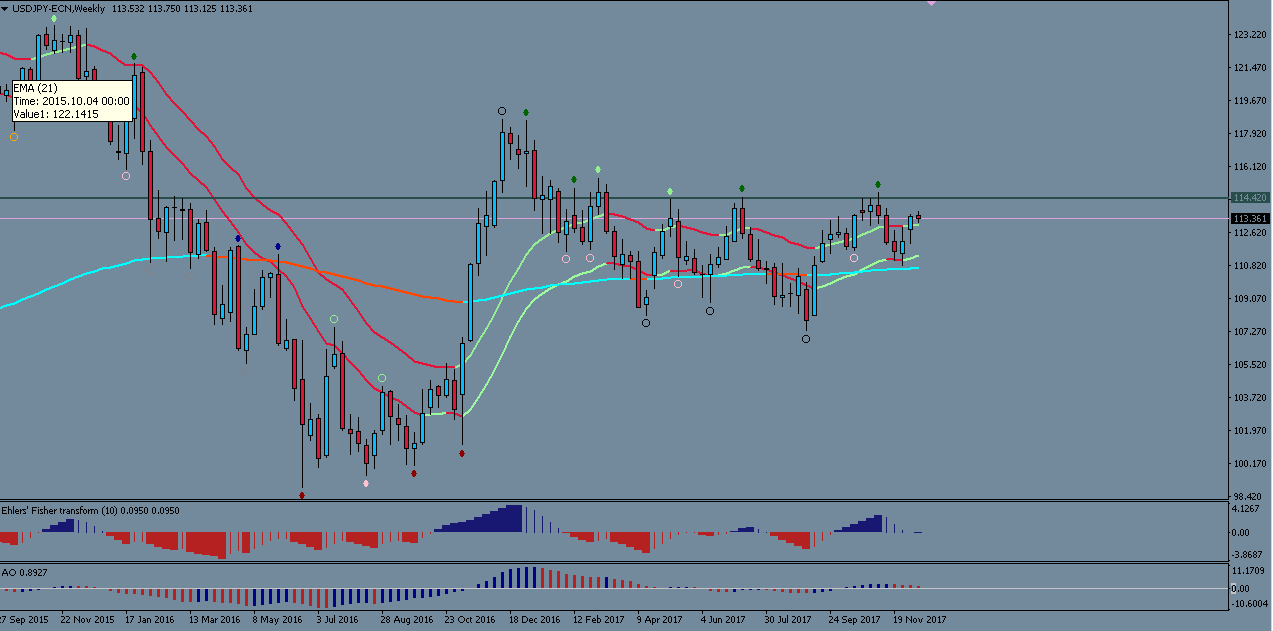
However the prolonged slow-down in momentum over the last few days is not a good sign and it could be that the USD will need yet another attempt before being able to break through. If we use the EUR/USD and GBP/USD charts as a cross-reference for USD strength, this would more likely indicate that the USD could suffer some more losses still at this stage.
FOMC… a key turning point?
A very decisive factor for the direction of the USD will be the FOMC meeting of today. What can we expect? Is there a bias to one or the other side?
My fundamental analysis leads me to have a bias that the FOMC meeting could be more bearish than bullish for the greenback.
The reason for this is that the rate hike itself is fully priced into the market already. Everybody expects the Fed to hike and to show strong conviction in future rate hikes. Therefore the much greater danger is towards disappointment of market expectations in case the Fed is less hawkish than anticipated.
This could then correlate with potential strong bounces against the USD at the decision zones, at which all 3 majors find themselves right now.
The proof will be in the pudding, as they say…
All the best along your trading journey…
Hubert
Follow Hubert on Twitter
SWAT


Leave a Reply