USD/JPY Daily Chart Shows a Possible Swing Down
November 15, 2019
2 min read
Subscribe

Dear Traders,
The USD/JPY has formed a pink dot which signals an overbought condition. MA’s have crossed down so we should see a swing to the downside.
108-60-70 is the zone where the price should drop from. If 109.60 holds we should see a move towards 108.30, 107.96, 107.24 and 106.50. Have in mind that the ATR(5) is 42 pips so the move could be slower. This is a counter trend trading opportunity as the trend is still up so pay attention to occasional profit taking as the price could go up on lower timeframes.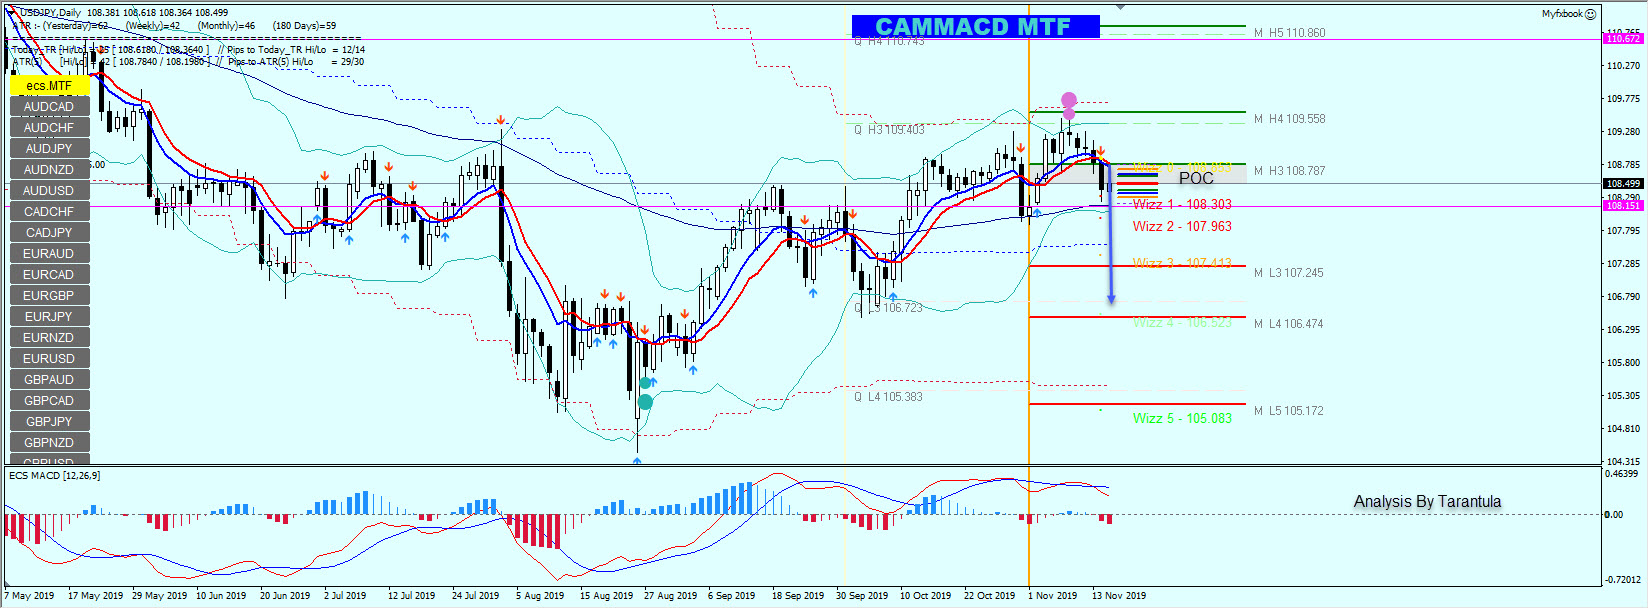
The analysis has been done with the CAMMACD.MTF template.
For more daily technical and wave analysis and updates, sign-up up to our ecs.LIVE channel.
Many green pips,
Nenad Kerkez aka Tarantula FX
Elite CurrenSea


Leave a Reply