Guide to Elliott Wave Crypto Trading & Analysis

Dear traders,
the theory behind the Elliott Wave (EW) principle explains the price movements on all charts. The main idea is that price action moves in bullish and bearish “waves”.
These wave patterns develop either in a straight line (impulse) or with ups and downs (correction). Price makes the same type of repetitive cycles in all financial markets, including cryptocurrency.
The waves are created due to the market psychology of all investors. This article explains the types of Elliott Waves crypto, how to analyse the wave patterns, and most importantly, how traders can trade them.
3 Types of Crypto Waves
The Elliott wave patterns were discovered by Ralph Nelson Elliott. The waves keep repeating on all time frames. Elliott noticed that the waves could be a) divided into smaller waves and b) added up to larger waves (wave degrees). The markets are “fractal” in nature with mathematical structures repeating on all scales.
There are 3 types of market environment: trend, counter trend, and range. Lets review how the crypto waves behave in each market type:
- Trend: the crypto waves progress in a clear direction (up or down).
-
-
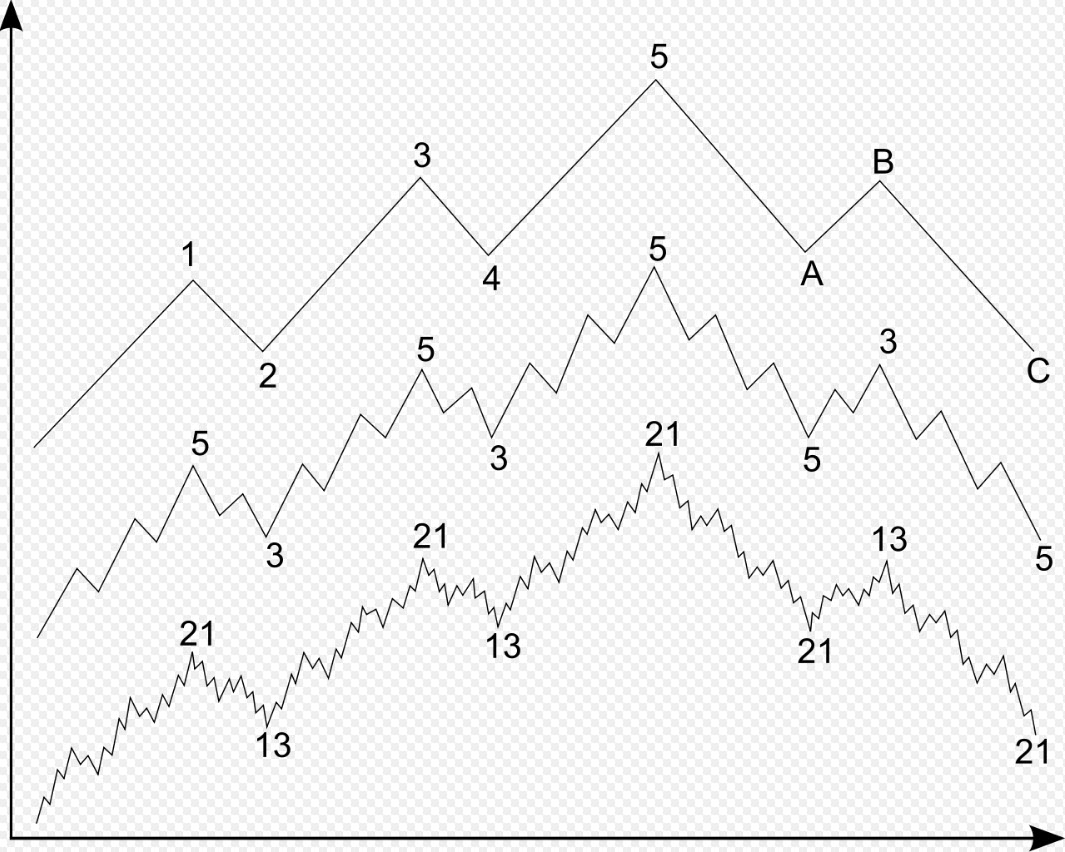
- There are 5 Elliott Waves crypto (12345).
- Waves 1, 3, and 5 show an advance.
- Waves 2 and 4 are a correction within the trend.
- Price is usually quick, called impulsive.
- Price moves up or down a lot.
- There are 5 Elliott Waves crypto (12345).
-
- Counter trend: the waves progress into the opposite direction of the trend.
-
-
- There are 3 counter Elliott Waves crypto (ABC).
- Waves A and C are against the trend.
- Waves B is a last but failed attempt with the trend.
- Price is often slower, called corrective.
- Price moves sideways and moves less up or down.
- There are 3 counter Elliott Waves crypto (ABC).
-
- Range: the waves turn and change directions often.
-
- There are at least 3 waves.
- But more crypto waves are possible if the correction is long and complex.
- Corrections can easily become complex because the market remains undecided.
- Simple ABC corrections form part of a larger WXY corrections.
Here is an image from the “Basis of the Wave Principle”, showing the standard 5 waves up and 3 wave down for an uptrend (downtrend has 5 waves down and 3 waves up).
To grasp the idea behind Elliott Wave crypto, it’s useful to imagine a tennis ball in relation to the ground.
- A ball will move away from the ground quicker if the speed is high.
- The ball will start to curve and fall back to the ground once the speed of the ball slows down.
- The ball will start to fall back to the ground because gravity is pulling it back.
The same thing happens with price on the chart. Quick price action will create crypto waves that move constantly in one direction (trend). Price will eventually lose its speed. Then price will move in the opposite direction (counter trend).
Or you can see waves like building blocks. You can connect waves to build larger waves. You can also find smaller waves within one single wave. Now the question is, how can you recognize and trade the price waves in the crypto markets in specific and financial markets in general?
Analysing Crypto Waves on the Chart
Elliott Waves (EW) are an excellent tool for analysing the crypto markets and for understanding the price movements on crypto charts. The Elliott Wave principle has rules and guidelines to help recognize the waves and wave patterns. But applying those rules correctly is not that simple. And trading Elliott Waves (on all financial markets) is difficult and requires experience.
Here are the 3 main Elliott Wave rules for cryptos and all financial charts:
- Wave 2 never moves beyond the origin of wave 1
- Uptrend: wave 2 does not break bottom of wave 1
- Downtrend: wave 2 does not break top of wave 1
- Wave 3 is never the shortest wave
- Wave 4 may not enter the price zone of wave 1 if the waves are impulsive
Sound simple enough? That said, there are many more Elliott Wave crypto guidelines available. In fact, we will not even mention all of them in this introduction article. Many of the guidelines connect Fibonacci with Elliott Wave.
- Wave 2 and 4 can sometimes alternate in form, for example, Wave 2 can show up as a zigzag wave while Wave 4 will be flat.
- A wave 2 is usually a deep retracement and a wave 4 is usually a shallow retracement.
- A wave 3 usually shows the strong impulsiveness.
- A wave 4 usually finishes at the wave 4 of a lower degree and around the 38.2% Fib (or 23.6 / 50% Fibs).
- A wave 5 usually shows divergence with wave 3.
- Wave B terminates at or below the start of Wave A
- Wave C typically terminates below Wave A.
- And many, many more
Ok, enough about rules and guidelines. It’s now time to discuss how they can help you in analysing the right crypto waves.
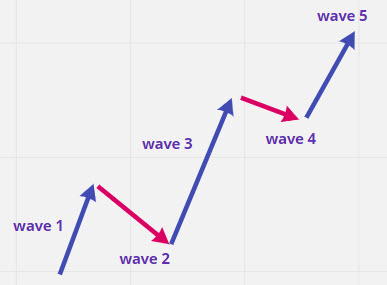
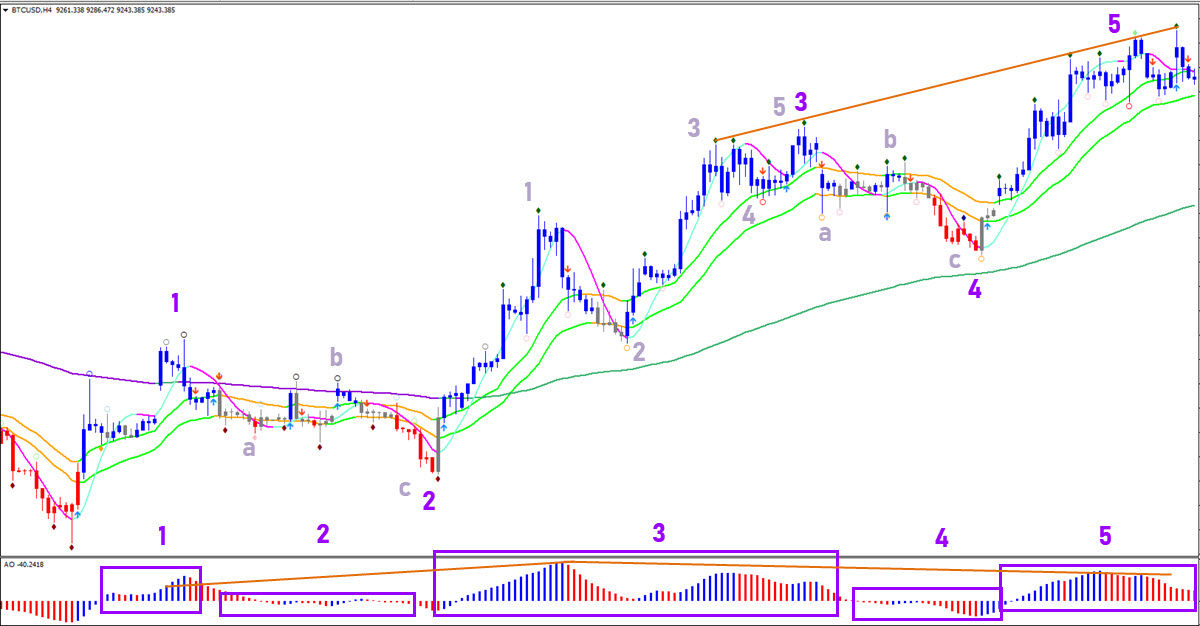
Let’s use a simple example on BTC/USD (see image below) to illustrate the principle.
- Price is showing strong bullish momentum.
- Then the correction in wave 2 does not break the bottom of wave 1.
- It is followed by an even larger surge upwards within wave 3.
- Followed by a shallow wave 4 correction and one more smaller push for wave 5.
- This is a typical 5 wave impulse.
The rules and guidelines of the Elliott Wave crypto help identify the correct crypto waves. There is just one problem: recognizing and trading the waves is easier said after the fact than done before the fact. But we mention a few solutions in the next paragraph.

Trading Elliott Waves on a Crypto Chart
How can you bridge that experience gap and use waves to your advantage?
The best way to trade the crypto waves is by using price indicators such as moving averages, Fibonacci, Fractals, and the MACD (or Awesome Oscillator). Traders can also add candlestick patterns plus impulsive and corrective price swings.
An even simpler way is to use our proprietary Meta Trader 4 (MT4) tools like my own swat.CANDLES. Alternatively, if you do not have access to the MT4 platform, you can also decide to use Heiken Candles.
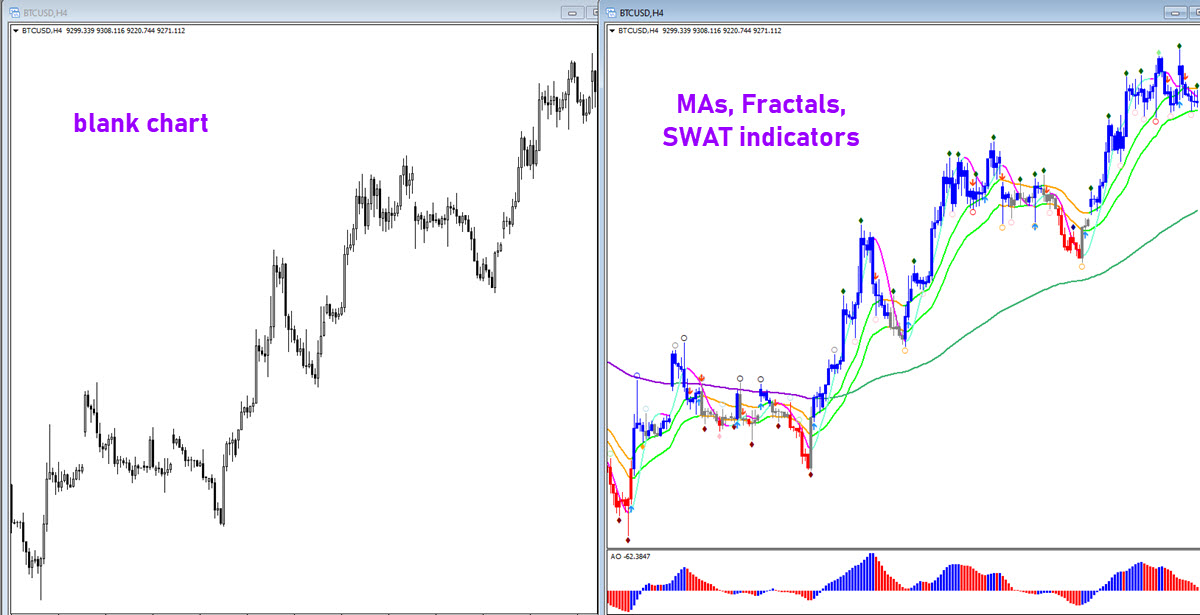
The image above compares normal charts with our SWAT Basic template. You can see how easy it is to spot and find the waves (see image below) with our method when comparing it to a blank chart with no indicators.
My swat.CANDLES and the entire SWAT (simple wave analysis and trading) method allows traders to trade the crypto waves without knowing the waves.
These tools help remove most of the guesswork from analysing and labelling wave patterns. It helps digest the price swings with a systematic method. This is an essential step, otherwise traders will keep second guessing their analysis and trade.
It also helps traders identify clear entry and exit points using rules based strategies. This in turn allows traders to follow a trading plan, which makes it easier to trade from a trading psychology point of view.
What are the Best Entries and Exits?
The best waves to trade are the impulsive waves 1, 3, 5 and also in some cases impulsive wave C. These waves move quickly and far thereby meeting two of your key goals as a trader:
- Your trade hits the target quicker
- Your trade has the potential to hit a larger target and generate a bigger profit
There are multiple benefits of hitting a target quickly. Firstly, it’s easier from a trading psychology point of view to stay in a short trade than long one. A long lasting trade offers a lot of moments to exit at the setup at the wrong point. Secondly, a trader can enter the market again once the old trade is closed. If you have ongoing trade setup(s), then adding more trades might be too much of a risk. But if you trade(s) close quickly, then there is less opportunity cost if a new setup appears on a different instrument.
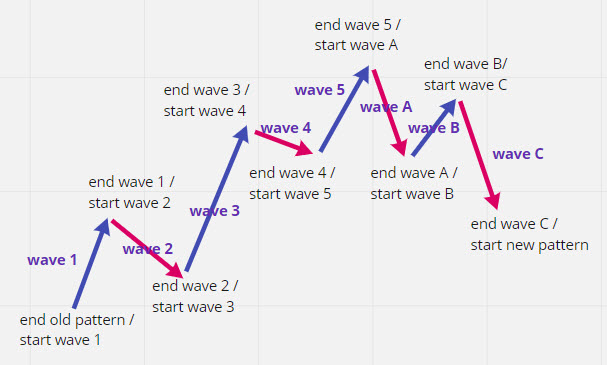
How can you actually trade those crypto waves? The best entry spots are the end and start of each Elliott Wave crypto. This works wonders, also in the crypto currency market. But also entries and exits just after the end and start do very well. Here are some ideas:
- Trading start of a wave: reversal candlestick patterns with the help of divergence patterns in the opposite direction (purple boxes).
- Trading confirmation of a wave 1: breakouts and bounces at the 144 ema close (green boxes).
- Trading confirmation of a wave 3, 5, and C: breakouts and bounces at the 21 ema zone for trading internal waves 1, 3 and 5 of wave 3, 5, and C (dark red boxes).
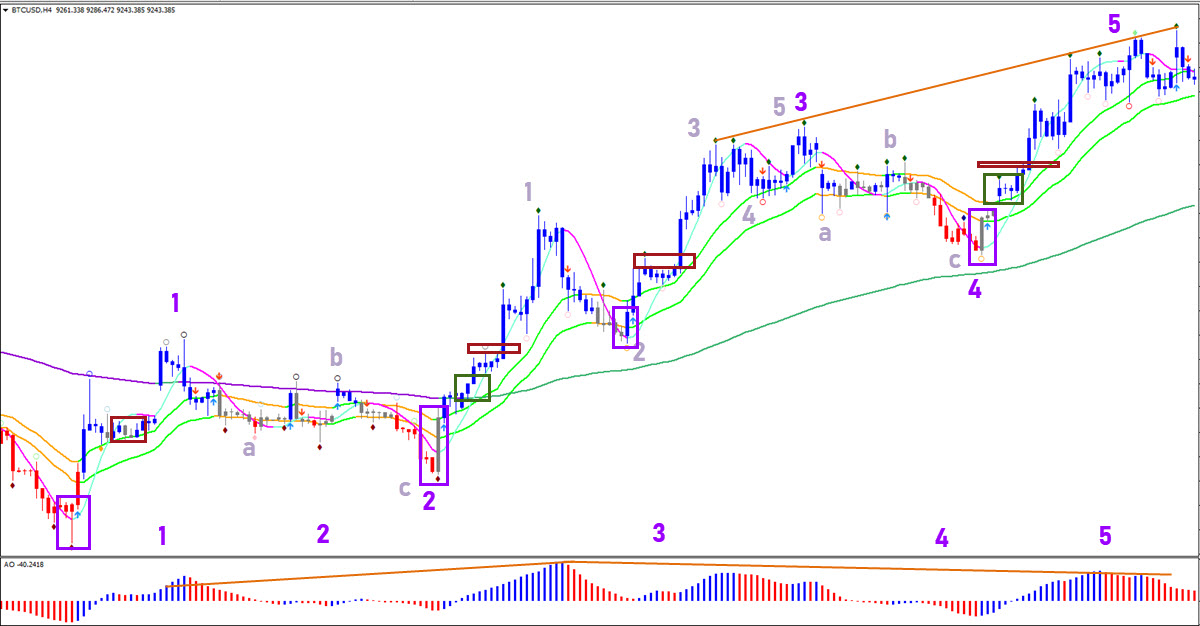
Trading breakouts and bounces can be done in different ways such as moving averages, Fibonacci, Fractals, and trend lines.
Traders can use rules based trading systems for very exactly defined entries and exits or use a looser set of ideas to guide their entry and exit decisions on a case by case basis. The former (rules) makes it easier to analyse but provides no space for custom changes. The latter (ideas) is based on discretionary (own) analysis which reviews the charts less strictly. Each cryptocurrency trader will have a preference for one or the other.
Please keep in mind one thing: do not buy near the top of the third or fifth wave by not trading too far in the trend. The best is to avoid a chart once double divergence patterns appear.
Summarizing Elliott Waves in the Crypto Market
Elliott Waves are a fascinating tool. They can provide a wealth of information for your crypto trading. But they also require a warning label: be careful and learn them properly.
Understanding crypto waves will unlock doors that never seemed open before, but only with the right training, tools, and knowledge.
Your cryptocurrency trading is likely to reach a depth never seen before if you spend enough time to master the skills and crypto waves. You can start with my guide: price action and the path of least resistance.
Good trading,
Chris Svorcik
ecs.SWAT creator


Leave a Reply