EUR/GBP Bearish Descending Wedge ? Marked By S&R Lines ?
Subscribe
Dear Traders,
the EUR/GBP recently saw a bullish spike after it failed to break below the support zone.
Does this indicate a potential bullish reversal or is price building a bullish retracement within a larger bearish correction?
Today we review the EUR/GBP daily chart in more detail.
EUR/GBP Reaches Resistance of Wedge
The bullish spike last week took price back to the top of the descending wedge chart pattern. The main question is whether price will break above the resistance (red) or below the support zone (blue).
Although we never know for sure, the chances of a bearish breakout still seem to offer better odds in my view. This is mainly due to two reasons:
- The bearish momentum prior to the wedge (orange arrow).
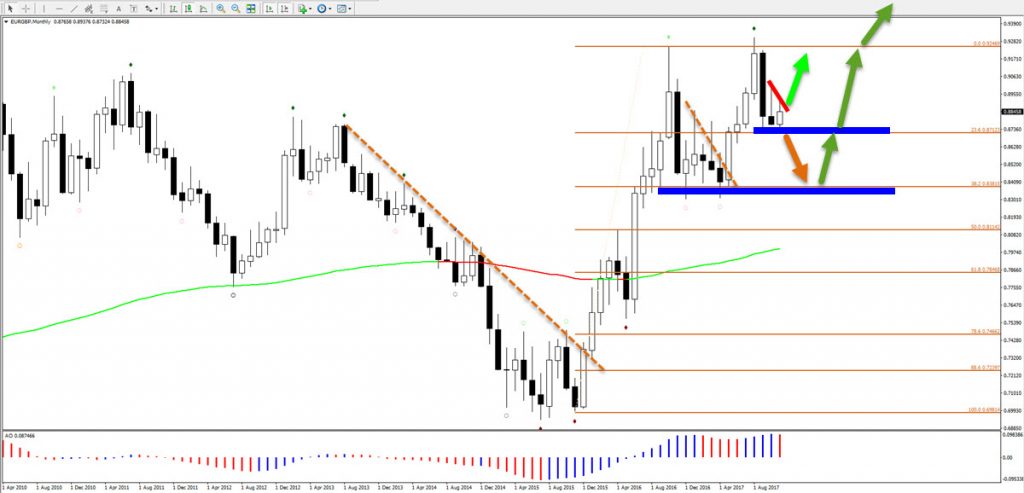
- Strong bearish monthly candles (see 2nd image).
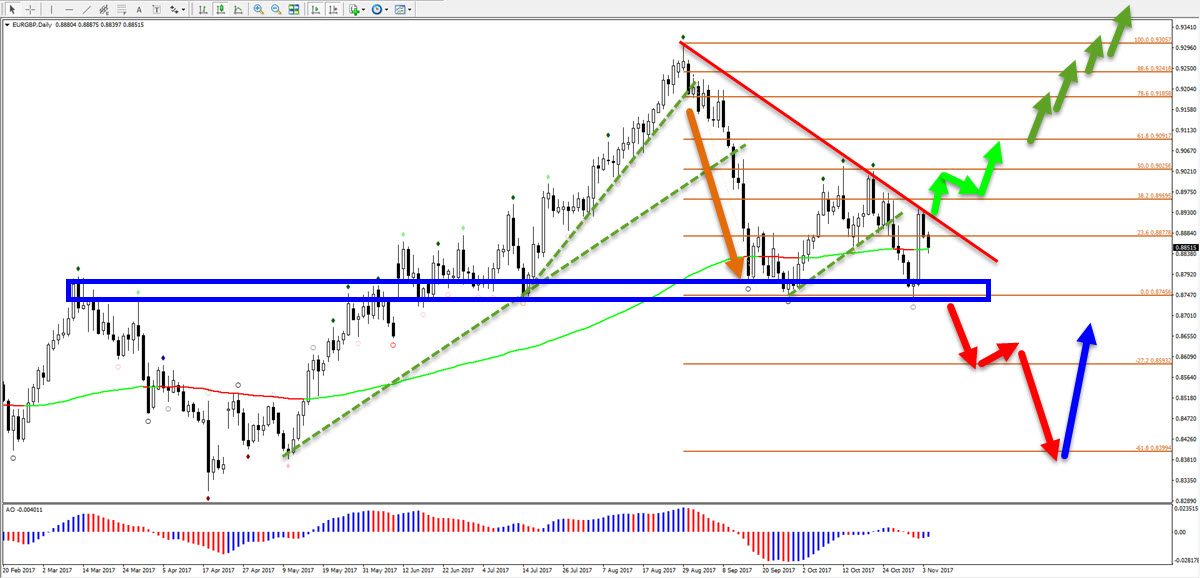
EUR/GBP Breakout Is Critical
The most important is to keep an eye on the support and resistance (S&R) trend lines. They mark the borders of the wedge and a break below or above S&R could indicate a breakout.
Let’s review the target for both a bearish and bullish breakout:
- The bearish break is aiming for the -61.8% Fib target at 0.84 although a small retracement could occur at 0.86 due to the -27.2% Fib target (red arrows).
- The bullish breaking is aiming for the 61.8% Fib retracement at 0.9090 (light green arrows) although a push above this could see further extensions (green arrows).
The bearish breakout, however, is only a retracement when considering the weekly point of view. I am expecting one more bullish push higher on this EUR/GBP weekly chart once the bearish retracement on the dialy chart is completed.
Good trading,
Chris Svorcik
.


Leave a Reply