5 Critical Fibonacci Basics for All Traders

Dear traders,
I’m sure that you have heard of the value of the Fibonacci tool for analysing the charts, for spotting support and resistance, for establishing entries and exits, and for filtering out bad setups.
Using the Fibonacci tool, however, is also challenging. To master the art and science of trading the Fibonacci levels, traders must build up and acquire sufficient experience.
Experience comes with practice and time BUT we hope that this article will be a small “short-cut” for those that are starting, struggling or looking to improve their trading with Elliott Wave and Fibonacci. Another short-cut is using a well established approach such as the ecs.SWAT method.
Fibonacci Sequence Levels
First of all, how are the Fibonacci levels calculated?
The Fibonacci levels (or simply called “Fibs”) are based on the Fibonacci sequence numbers. Lets first explain how the sequence levels are used for the Fibs but please note that you can use the Fib tool without this math. By the way, the Fibonacci retracements are also called Fib tool and Fib retracement OR plainly Fibs, Fibo or Fibo tool. All of these abbreviations simply refer to Fibonacci and are used to save time and provide variation.
The Fibonacci sequence numbers are: 0, 1, 1, 2, 3, 5, 8, 13, 21, 34, 55, 89, 144, 233, 377, 610, 987, 1597, and so on. This line series is created simply by always adding the first two numbers together and then taking the last two numbers for the next number:
- 0 + 1 = 1 → 1 +1 = 2
- 1 + 2 = 3 → 2 + 3 = 5
- 3 + 5 = 8 → 5 + 8 = 13
- The method stays the same for higher numbers as well:
89+144 = 233, and then 144 + 233 = 377, etc.
You might be wondering, why are these Fibonacci sequence numbers important? There are a couple of reasons that answer this question:
- The Fibonacci sequence numbers are in fact very well respected levels on the charts.
- The Fibonacci sequence levels are used for calculating Fibonacci retracements and Fibonacci targets, which are key levels on the charts.
The Fibonacci retracement levels are calculated by dividing a smaller Fibonacci sequence number by a larger Fibonacci sequence number. A result lower than 1 is visible: 144/233 = 0.618. Here are a few other examples:
- 8/13 = 0.618 (smaller number is divided by bigger number next to it)
- 34/89 = 0.382 (smaller number is divided by bigger number two next to it)
Simply said, Fibonacci retracements are levels below 1 whereas Fibonacci targets are levels above 1. Many ratios can be calculated by dividing the Fibonacci sequence numbers in various ways:
- If we divide 13 by 21 for example, we get 0.619.
- While 21 divided by 13 = 1.615.
- If we divide 8 by 21 we get .381.
- Conversely, 21 divided by 8 is 2.625.
The higher the numbers, the closer the ratios will reflect the standard ratios of 0.618 and 0.382.
- 144 divided by 233 is 0.61802.
- 144 divided 377 is 0.38196.
One interesting aspect is that it doesn’t matter where we start. We can take any two numbers, like 5 and 100. Soon we’re dealing with the same series – we are getting the same ratios: 5, 100, 105, 205, 310, 515, 825, 1340, 2165. 1340 divided by 2165 = 0.6189 2165 divided by 1340 = 1.616.
Fibonacci Retracement Levels
As mentioned above, Fibonacci retracement levels are ratios which are based on the Fibonacci sequence numbers and have values between 0 and 1 (such as 0.618). In many cases we also use percentages to describe the ratio, for instance 61.8%. There are 3 main Fibonacci retracement levels:
- The 0.618 level or 61.8%.
- The 0.382 level or 38.2%.
- The 0.236 level or 23.6%.
The 0.50 level or 50% is also used as a Fib number but it is not based on Fibonacci sequence numbers and therefore not a real Fib level. Despite that, it is still added to the chart because of its value as the halfway mark and its importance for market psychology.
Last but not least, the 61.8 ratio is extra important and called the Golden Phi, which is also called the Golden Ratio. Kepler called it “one of the jewels of geometry“, Pacioli named it the “divine proportion“, and finally Greeks used the letter “phi“. The Phi is a crucial element in Forex Trading. Two quantities are in the golden ratio if: the ratio of the sum of the quantities to the larger quantity is equal to the ratio of the larger quantity to the smaller one. In math this means ((A+B)/A) = PHI. The PHI is equal to 0.618. That is why the 61.8 or 61.8% Fib retracement level is so important in Forex trading.
There are more Fibonacci retracement levels than the 3 mentioned above, although some of these levels are calculated differently:
- 786 or 78.6% – square root of 0.618.
- 886 or 88.6% – square root of 0.786.
There are a few other Fibonacci levels that I personally do NOT use but that are occasionally applied by other traders such as:
- 146 or 14.6%
- 764 or 76.4%
Shallow vs Deep Retracement Fibs
It is important to know the concept of shallow versus deep Fibs.
Shallow indicates that price has not retraced very far on the Fibonacci ladder, whereas with deep Fibonacci levels price has retraced a lot further.
Here is a list that shows all four categories:
- Shallow Fib levels: 23.6% and 38.2% Fib levels.
- Medium Fib levels: 50% and 61.8% Fib levels.
- Deep Fib levels: 78.6% and 88.6% Fib levels.
- Top or bottom: 0% and 100%.
Advantages of Fib Retracement Levels
The Fibonacci retracement levels can be used for:
- Entries
- Bounces and reversal
- Filtering out setups
Let us discuss in more depth the value when price reaches one of the Fibonacci retracement levels, this means that price has retraced back to a ‘discounted’ level. Let us use this example: EUR/USD moves down from a top at 1.1474 to a bottom at 1.1183. Price then starts to retrace higher so we place the Fibonacci tool from top to bottom (also called a swing). Retracement levels are support & bounce spots in a trend so price can use 1 of the Fib levels to continue with the downtrend again. The market uses Fibonacci retracements levels because it provides a ‘discount’ within a trend.

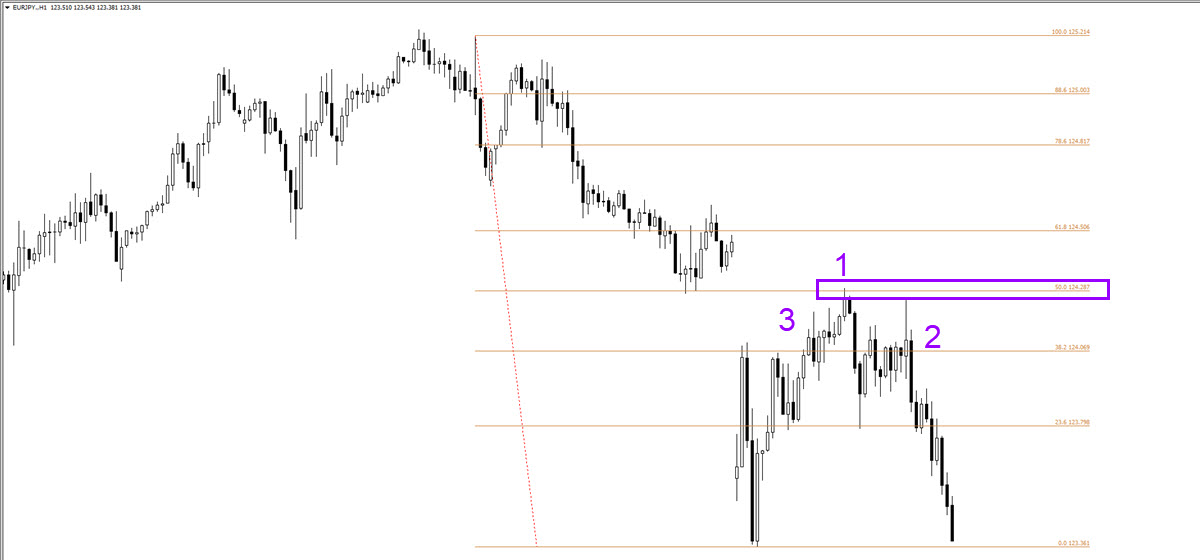
The Fibonacci levels offer a discount and therefore are interesting for potential entries with the trend. Although the Fibonacci levels can be used for direct entries, they can also be used as a point of confluence (POC) where traders wait for candlestick patterns to confirm the bounce or reversal.
Last but not least, traders can also use the Fib levels as a filter, which means avoiding a setup. For instance, if price is before a key 50% Fibonacci retracement level which is likely to act as resistance, then taking a long setup would offer low probability and low profitability in the long run. Using Elliott Wave Rules can save you the hassle and skip a trade.
How to Add the Fibonacci Tool
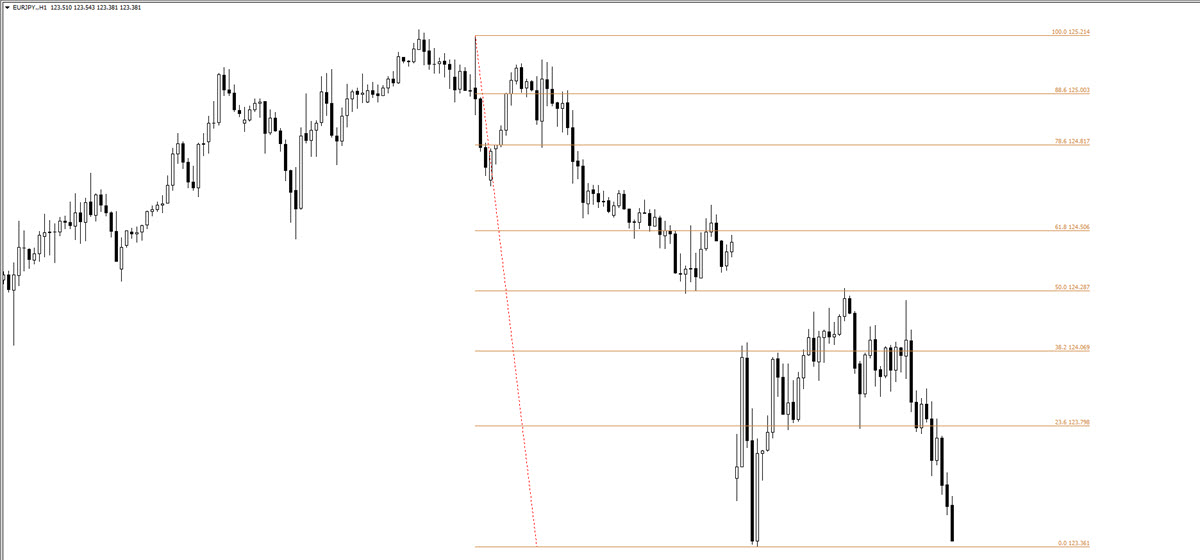
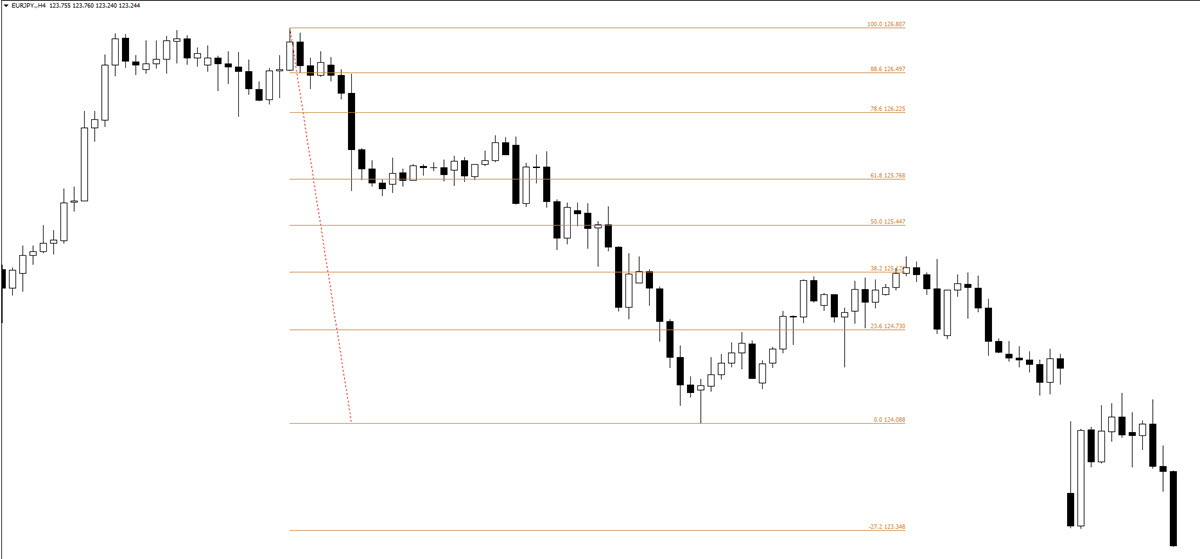
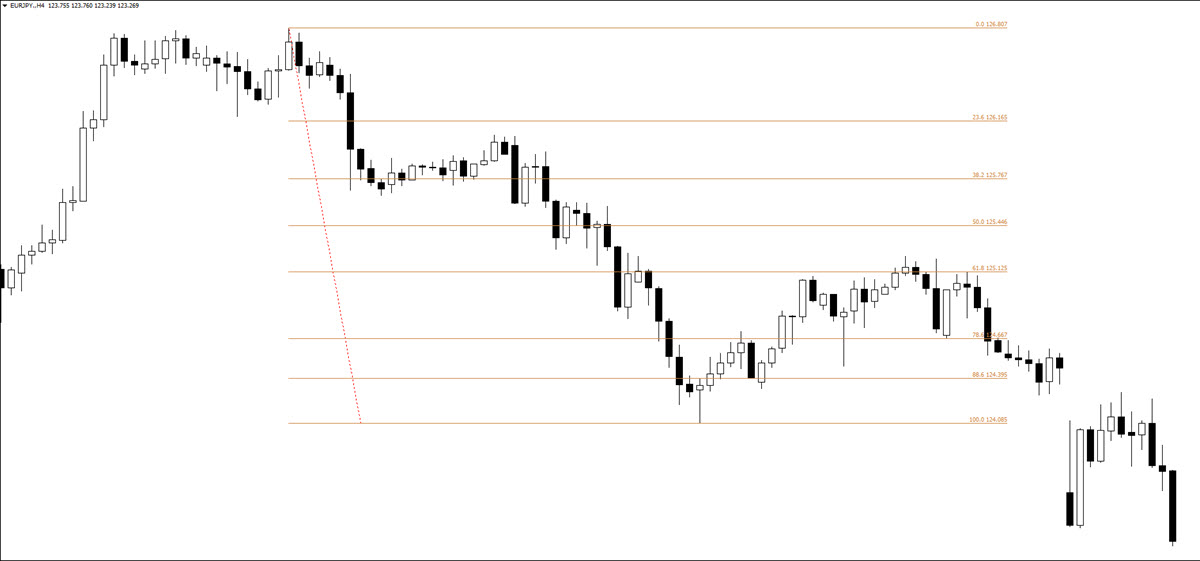
The Fibonacci tool can be added to the chart to quickly place the Fibonacci retracement levels on the chart. Generally there are two different ways of placing a Fibonacci tool on the chart. Nenad and I prefer the method which drags the tool from left to right (1st image), but there are some who prefer the opposite (from right to left – see 2nd image).
How do you get the price levels to appear next to the Fibonacci retracement levels? In the MetaTrader 4 (MT4) you need to click on the start or end point of the Fibonacci tool, then click on “Fibo properties” and then go to Fibo levels. Then add in the description behind the numbers a “space, percentage sign, and then a USD sign”.

For more information, free analysis, webinars, videos, tools, systems, and methods for trading stocks, cryptos, Forex and options, please check out our website www.EliteCurrenSea.com.
Wish you good trading,
Chris Svorcik


Leave a Reply