🎯 NZD/USD Aims at 0.75 for +250 Pips After Completing Wave-4 🎯

Dear traders,
the NZD/USD is building a choppy, sideways price movement at the 21 ema zone. This is typical for a wave 4 correction.
This article reviews what to expect after a wave 4 is completed. We also analyse potential trading ideas and targets.
Price Charts and Technical Analysis
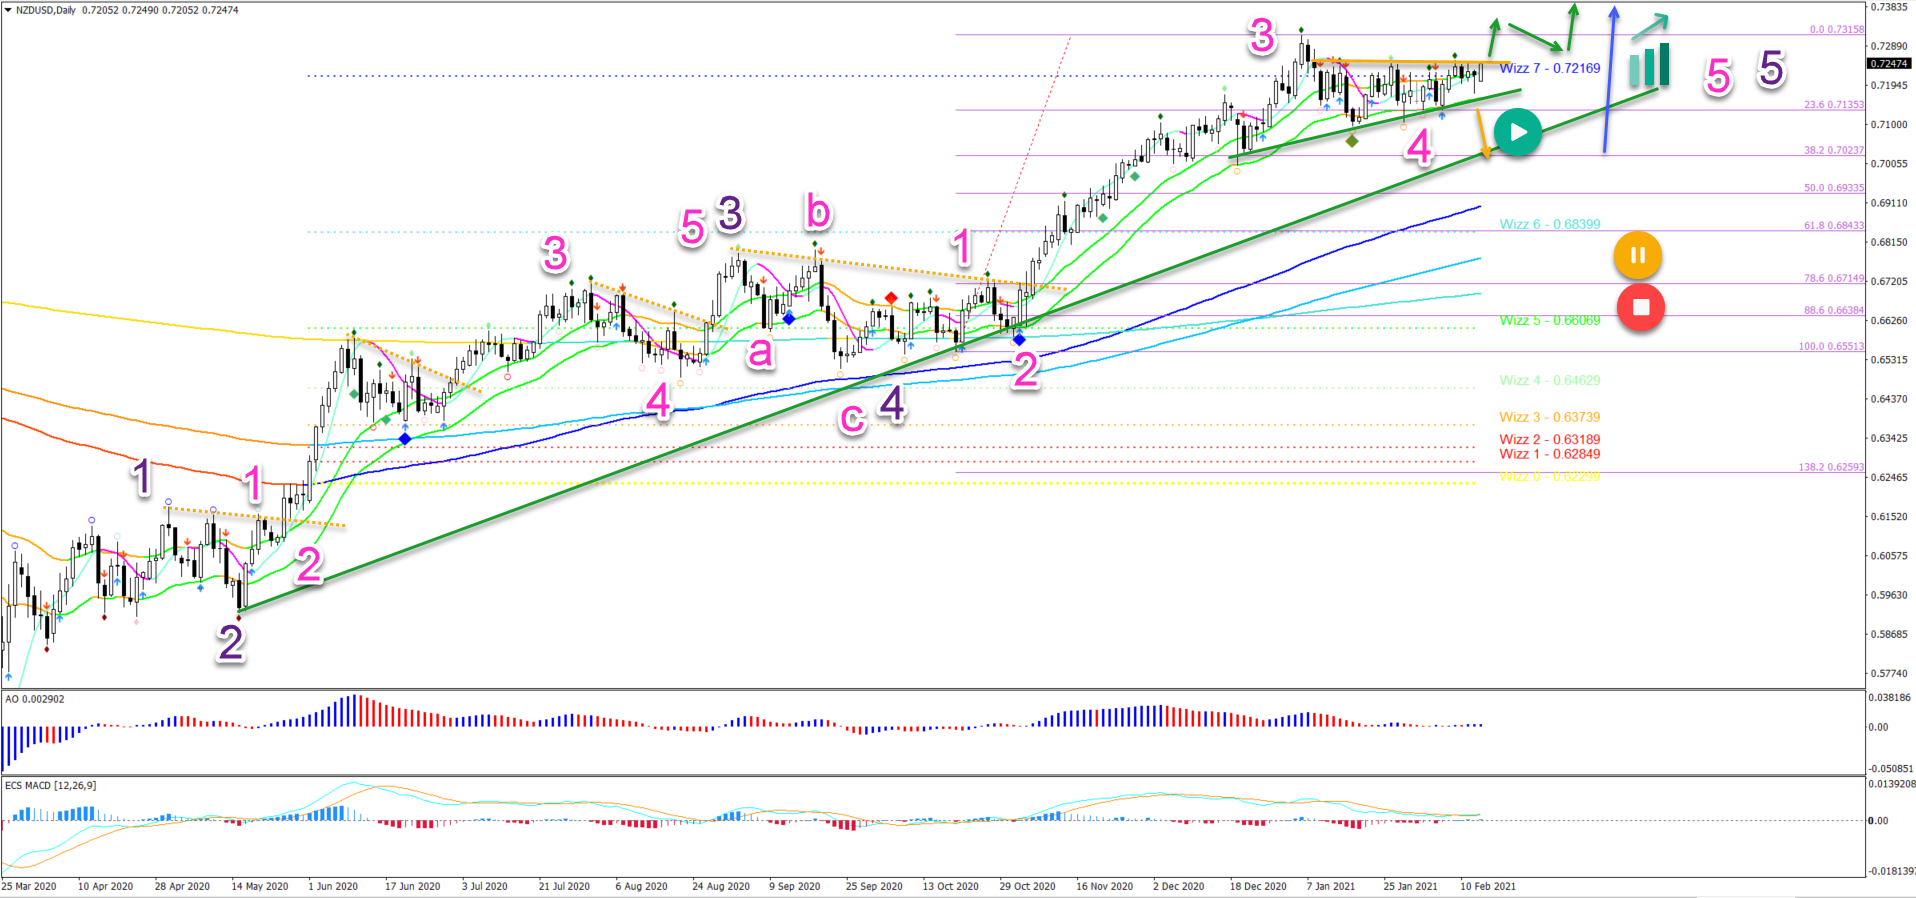
The NZD/USD seems to have completed a wave 4 (pink). Here are the main factors:
- Price action showed a strong impulsive move up in wave 3 (pink).
- The correction has been choppy as expected.
- The 21 ema support zone is acting as support.
- The long-term moving averages are aligned.
- Price action respected the shallow 23.6% Fibonacci retracement level.
- Price action is trying to break above the 21 ema zone.
- A triangle chart pattern is visible.
The confirmation of the uptrend continuation occurs when price action manages to break (green arrows) above the resistance trend line (orange).
The main target of the wave 5 (pink) is the -27.2% Fibonacci target at 0.75.
A bearish breakout does not mean that the uptrend is over. The 38.2% Fib and support trend line (green) are likely to create a bullish bounce (blue arrow).
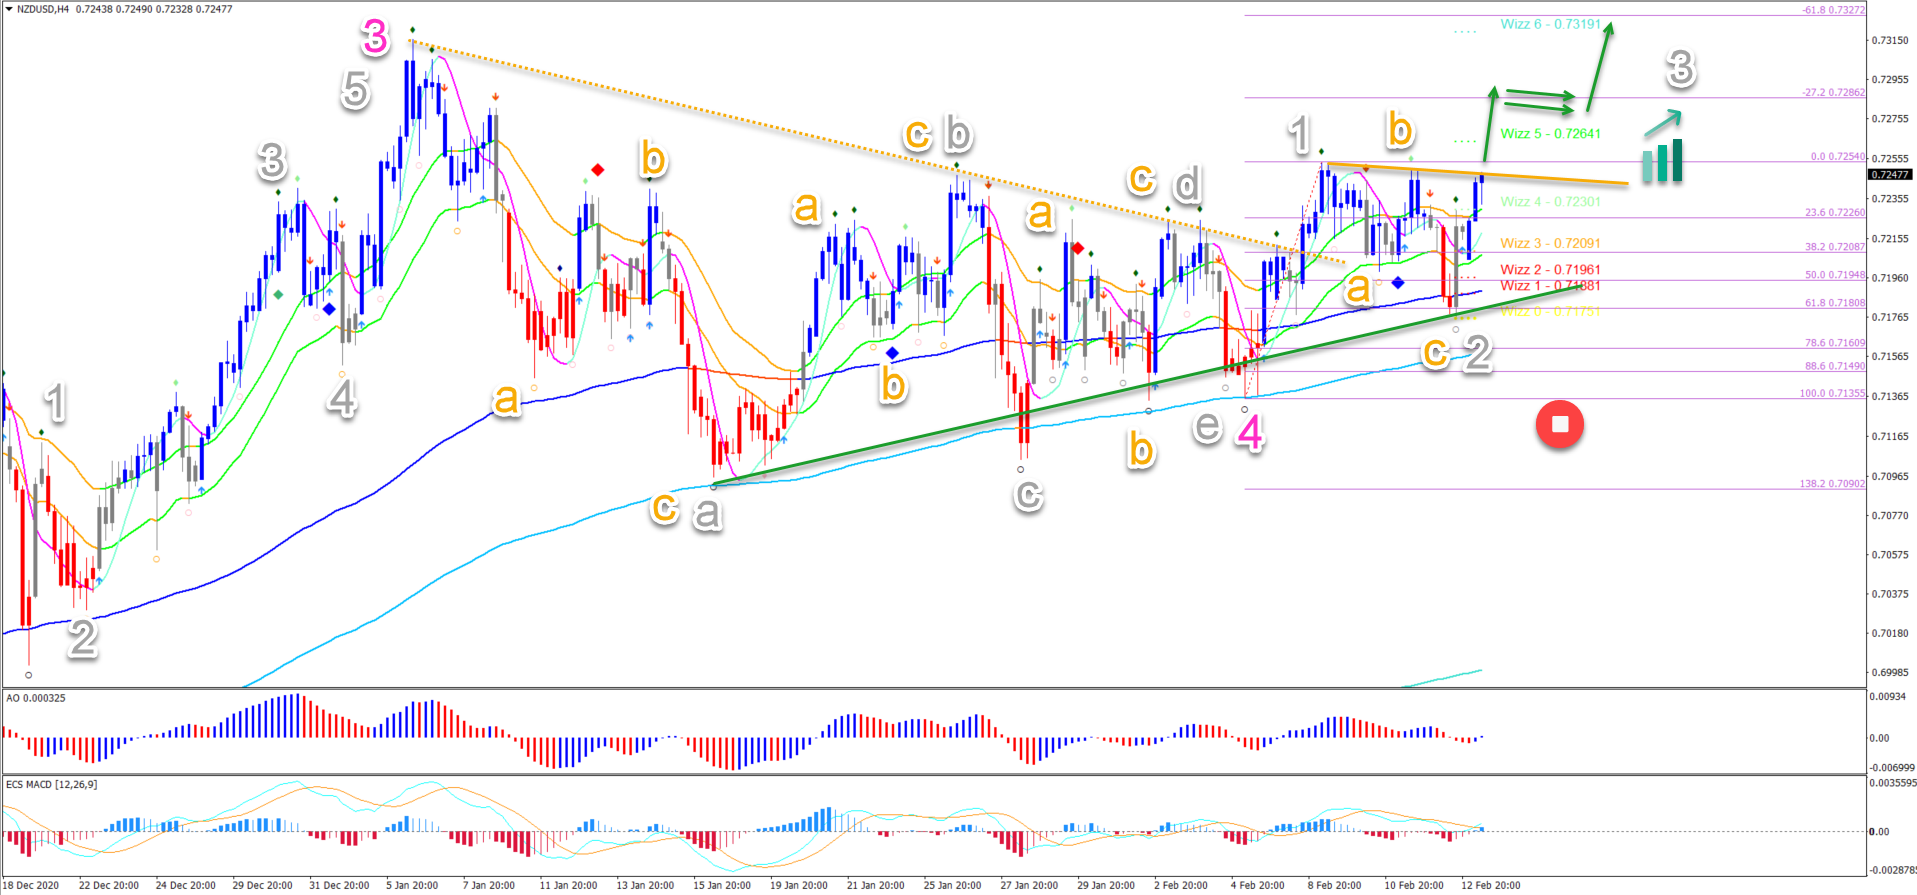
On the 4 hour chart, price action seems to have completed an ABCDE (grey) triangle chart pattern within wave 4 (pink).Now price action is pushing up via a wave 1-2 (grey).
A breakout could confirm the start of the wave 3 (grey). But it is key to see a bull flag emerge after the breakout. Strong bearish price action should not appear.
The bullish outlook remains valid as long as price action remains above the 100% Fibonacci of wave 2 (grey). A break below invalidates it (red circle).
The analysis has been done with the indicators and template from the SWAT method (simple wave analysis and trading). For more daily technical and wave analysis and updates, sign-up to our newsletter.
Good trading,
Chris Svorcik


Leave a Reply