🚥 NQ 100 at Equilibrium but Final Bearish Wave C Remains 🚥
Dear traders,
the Nasdaq (NQ) 100 is retesting the 21 ema zone. A bullish or bearish break will be critical for either an uptrend or deeper retracement.
This article reviews when the NQ 100 is expected to resume its uptrend. Let’s start with the daily chart.
Price Charts and Technical Analysis
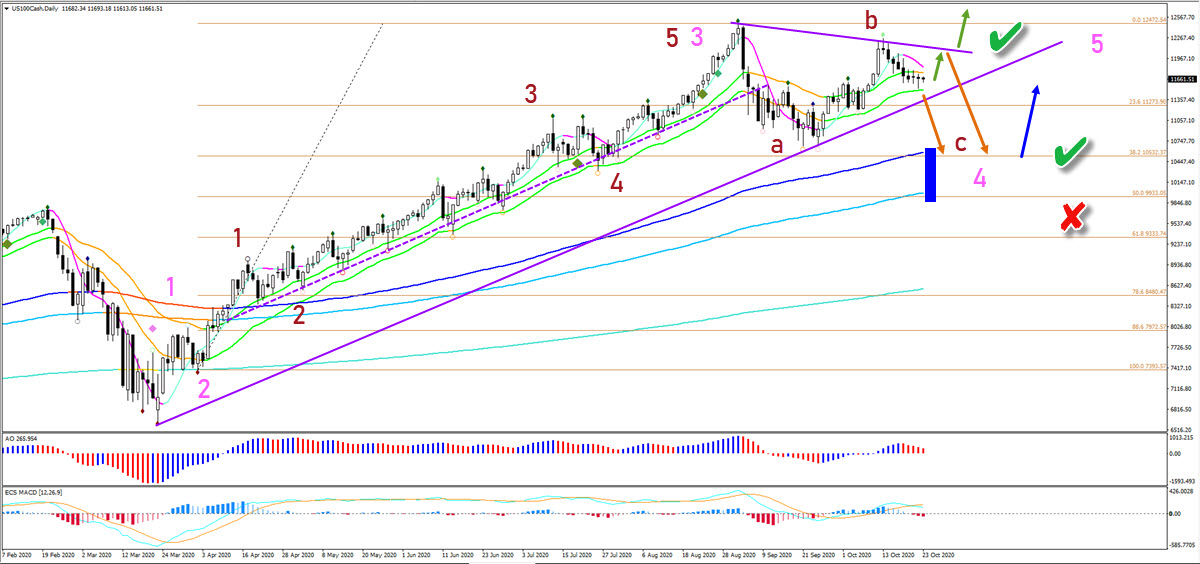
A bullish break above the 21 ema zone is not enough to confirm the uptrend. Why? Because of the resistance trend line (purple) that could halt price action and send it down again.
Only a break above the resistance line and Fractal could confirm the uptrend and start of wave 5 (pink). Otherwise, a bearish bounce at the resistance or a breakout below the 21 ema zone should confirm a deeper wave 4 (pink).
We will then see a bearish ABC (red) pattern emerge. The main target of the wave C (red) is the 38.2% Fibonacci retracement level (blue arrow). A break below the 50% Fib makes the wave 4 (pink) less likely (red x).
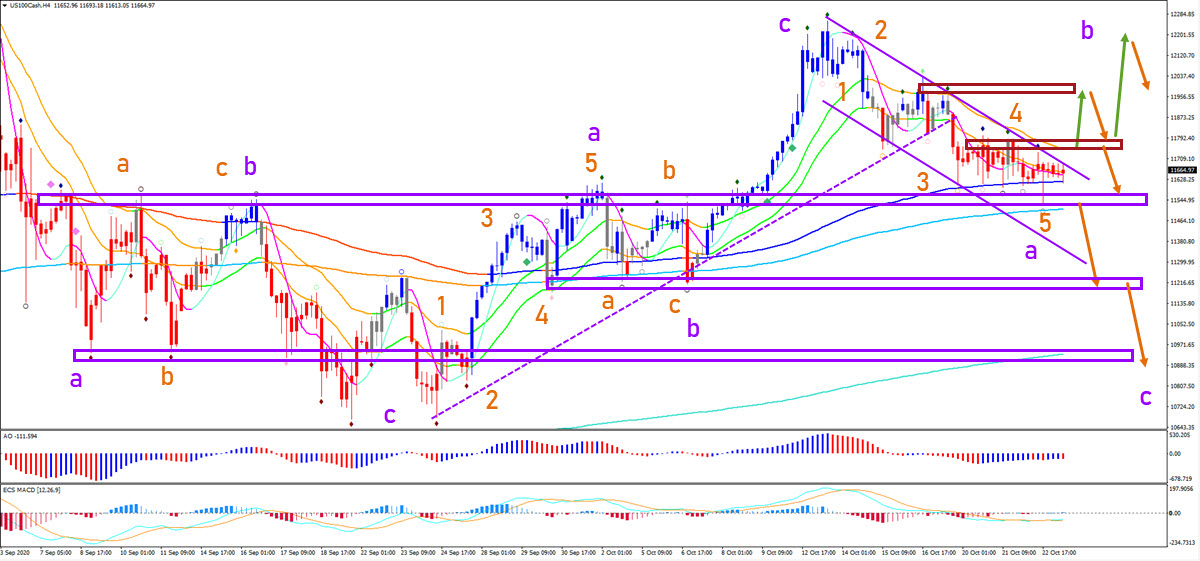
On the 4 hour chart, we see multiple completed ABC patterns (purple). Price action has now returned back to the equilibrium and mid point of the range.
A bullish bounce is likely an ABC within a larger bearish wave B (purple). The next price swing after the wave B is expected to be a bearish wave C (purple).
The analysis has been done with the indicators and template from the SWAT method (simple wave analysis and trading). For more daily technical and wave analysis and updates, sign-up to our newsletter.
Good trading,
Chris Svorcik


Leave a Reply