Using the Candlestick Wick to Measure True or Fake Breakout
Subscribe
Dear Traders,
Trading a breakout is difficult for most traders due to the danger of false breaks. This happens when price setups a break but then actually fails to continue.
Is there a way how you can avoid fake breakouts?
Luckily there are tools and methods that help our odds of success. This article explains how we use the candlestick wick to measure the strength or weakness of a breakout. (Video of this article is at the very bottom)
Also check our complete Elliott Wave and Fibonacci guide.
Trading Breakout, Fake Breaks, Fake Fake Breaks
Trading breakout setups and fake breakouts can be challenging. It’s seems to be “Murphy’s law” that traders choose the wrong side when trading breakout setups:
- A breakout turning out to be a false break.
- A false break turning out to be a good breakout.
- A failed false break turning out to be a false break.
Confusing right? Is there a solution?
No method is perfect but Nenad and I prefer using two main concepts for choosing the right direction, besides our “5 Key Tips for Trading Breakouts Like a Pro Trader”:
- Understand trend and momentum – please see our trend articles for more info.
- Use candlesticks and their wicks for measurement.
Today’s focus is on the second point: candlestick wicks.
How to Calculate Candle Percentage and Measure Wicks
Before we explain our method of analyzing candlestick wicks, let’s first explain how to measure the candlestick wick and how to measure the wick percentage.
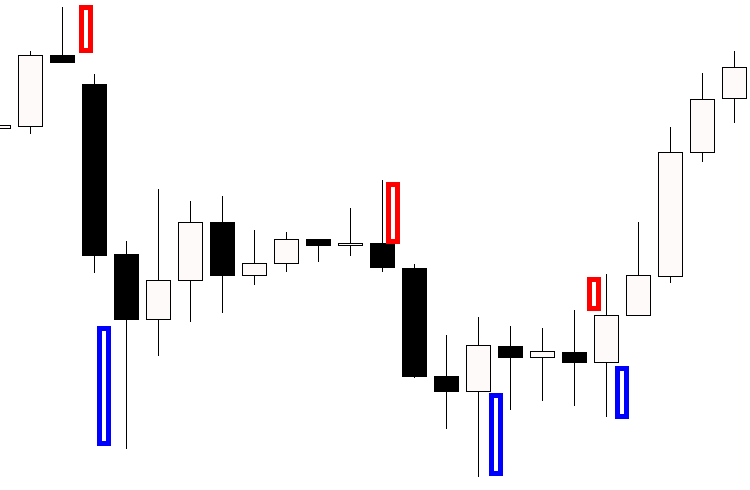
Image showing wicks on top of the candlestick (red) and wicks on the bottom (blue).
Candlestick wicks are measured like this for bullish candle:
- Candle high minus candle low = candle size
- High of candle minus candle close = wick on top of candle
- Open of candle minus candle low = wick on bottom of candle
Candlestick wicks are measured like this for bearish candle:
- Candle high minus candle low = candle size
- High of candle minus candle open = wick on top of candle
- Close of candle minus candle low = wick on bottom of candle
The wick percentage is measured by taking the wick and dividing by the candle size.
- So a wick of 10 pips with a candle size of 40 pips has a 25% wick ratio (10/40).
- A 20 pip wick with a 160 pip candle size has a ratio of 12.5% (20/160).
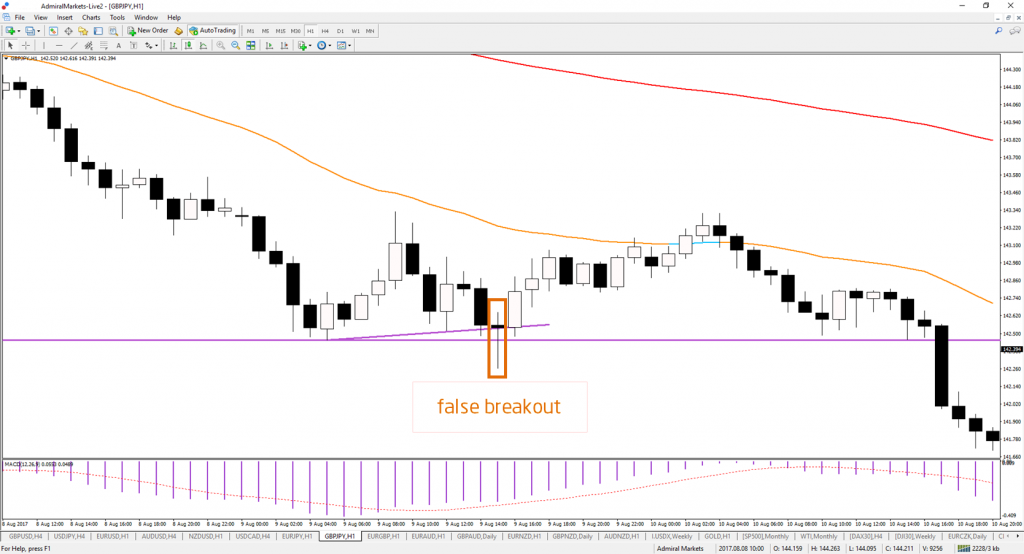
Image showing false break.
The Importance of Candlesticks during Breakouts
The trick and key tip is to focus on the breakout candlestick. This candle is the most important candlestick because that is when the market is testing the support or resistance (S&R) level, which is called a “decision zone”.
Decision zones are where price shows its true intent and direction:
- Bounce: price does not break.
- Breakout: price breaks with good momentum.
- False bounce: price bounces but then breaks later on.
- False break: price breaks but fails to continue.
- A false “false break”: price breaks, fails to continue, but then manages to break properly.
For instance, look at the chart example here where I was looking for a break of the contracting triangle chart pattern (purple lines).
The decisions zones are the purple trend lines in this case:
- A bounce is indicated by the green box (#1).
- A false break is indicated by the red box breaking above the orange trend line (#2).
- A breakout is indicated by the red arrows (#3).
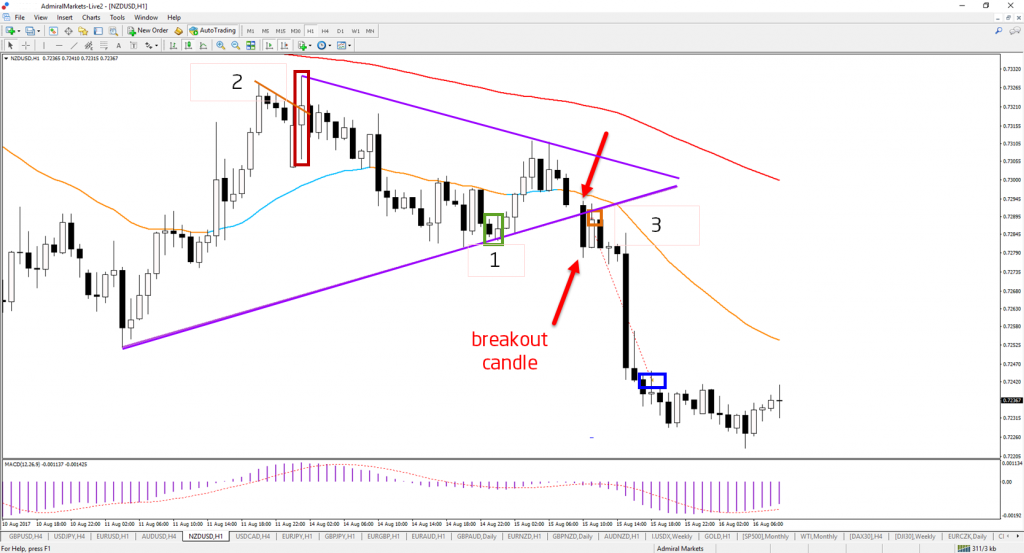
Image showing good breakout candle
I entered the 3rd one, the bearish candlestick breakout, at the orange box and saw the trade close for a +44 pip win at the blue box – the entry was based on the ecs.SWAT system.
The main message is this:
The candlesticks challenging S&R levels and decision zones are the most important ones to monitor.
Here is a step-by-step overview:
- Find breakout zone or level (decision zone).
- Wait for price to reach the decision zone.
- Monitor reaction of candlestick.
- Understand the breakout and direction.

Candlestick Wicks and Closes
The next part of our article will explain how the interpret the breakout candlestick.
The key ingredient is the candlestick close.
This measures whether the breakout is strong or weak:
- A “strong” candle close indicates a good breakout.
- A “weak” candle close indicates a false breakout.
To understand what is strong or weak, it is also important to know the direction of trading:
- Bullish price action challenging resistance indicates a potential bullish breakout.
- Bearish price action challenging support indicates a potential bearish breakout.
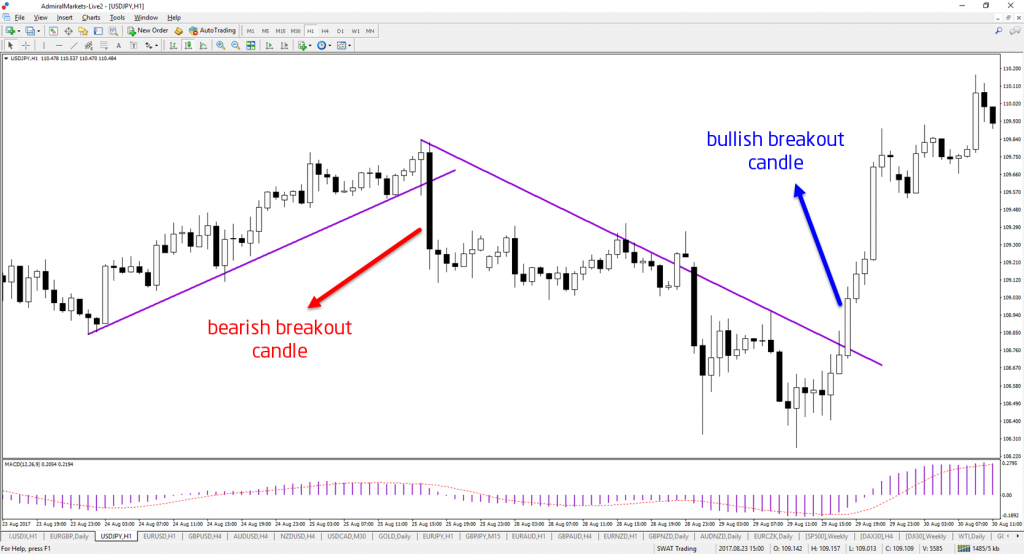
Image showing good breakout candles.
Now we can combine both parts:
- A strong bullish breakout: candle closes near the candle high.
- A strong bearish breakout: candle closes near the candle low.
Which time frame?
Traders can use the same time frame as the entry or zoom out one time frame to confirm the breakout there. For example, if I’m looking to trade a break of the 1 hour support level, using the 1 hour candle for the breakout measurement is fine but using the 4 hour chart is ok too.
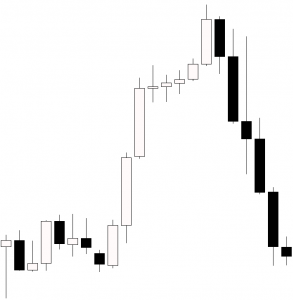
Image show strong candle closes up and down.
Measuring the Candle Wick
A strong candlestick close sounds useful but how do you know what is “strong” or “weak”?
Luckily, this is a simple calculation. All you need is to do is this for bullish breakouts (bearish in brackets):
- Measure candle size, high minus low.
- Measure candle wick, high candle close (bear: low).
- Compare candle wick to candle size.
Let’s use a bearish example on the GBP/USD:
- High is 1.2963.
- Low is 1.2909.
- Open is 1.2962.
- Close is 1.2919.
With the numbers mentioned above, we can see that the GBP/USD has this breakout:
- Candle body is high minus low is 1.2963 – 1.2909 = 54 pips.
- Candle wick is 1.2919 – 1.2909 = 10 pips.
- Compare wick of 10 pips with candle size of 54 pips, which is 10/54 = 18.5%.
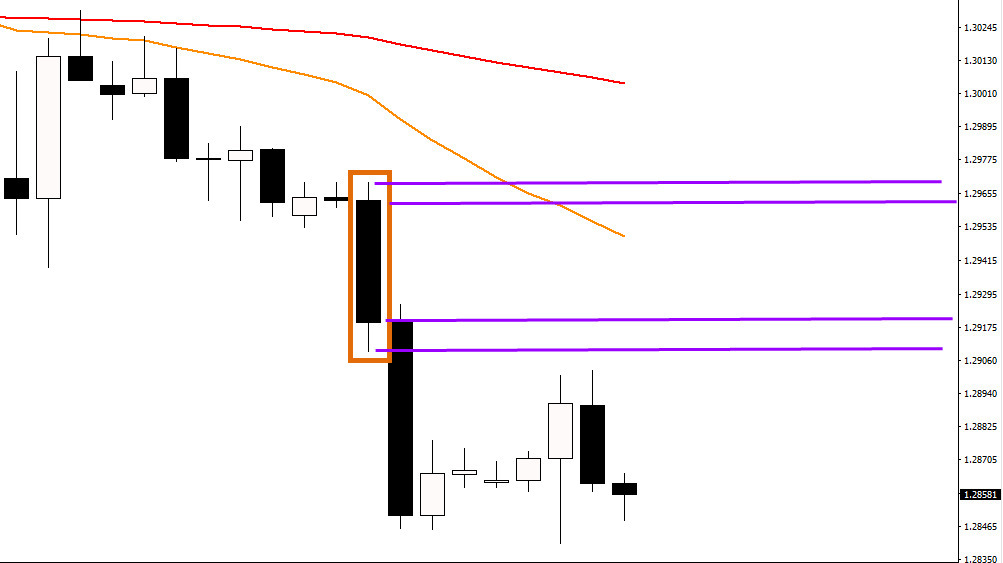
Image showing bearish candle example.
Guide for Understanding Breakout Strength & Weakness
The last and final step is to understand which breakouts are strong and which ones are weak. That is why we made a guide how to compare candle wicks.
Remember, a candle that has little or no wick is showing a strong candle close. The two are opposites of each other: a wick indicates a weak candle close.
Here is the rule book used for measuring breakouts:
- 0-5%: excellent strong candle close.
- 5-10%: very strong candle close.
- 10-20%: strong candle close.
- 20-25%: good candle close.
- 25-30%: ok candle close.
- 30-35%: doubtful candle close.
- 35-50% indecisive candle close.
- 50-67%: weak candle close.
- 67-100% very weak / reversal candle close.
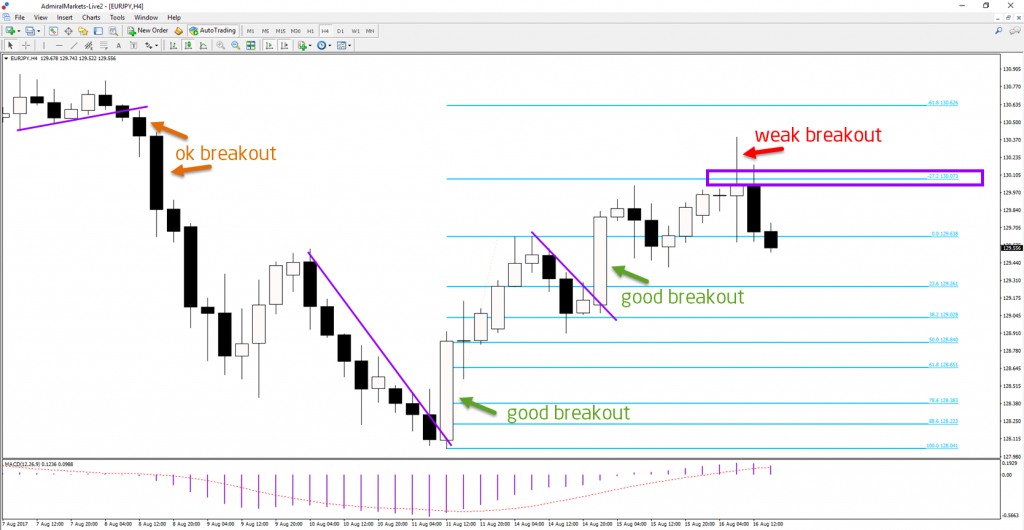
Image show breakouts.
What are good breakouts?
- The best breakouts have candles which close near the top 20% of the candle size.
- They work ok with wicks between 20 and 30%.
- Risky between 30 and 40%.
- Turn easier into false breaks out above 40%.
- Can lead into reversals more often above 67%.
The above guidelines helped me with multiple aspects:
- Recognizing strong breakouts and false breakouts
- Focusing on trading strong breakouts.
- Knowing when to trade false breakouts and reversals.
- My understanding of the psychology behind each candle.
If you still find trouble applying the methods above, feel free to join our telegram group by either purchasing the monthly access for €109/month or by joining one of our supported brokers and getting a free month of signals.
Many green pips,
Chris Svorcik
More info on our ecs.SWAT course and trading system
Twitter: @EliteCurrenSea
YouTube: Elite CurrenSea


Leave a Reply