Trading the Break after the Pattern Break (and Avoiding False Breakouts)
Subscribe
Dear Traders,
You probably have noticed the risk of catching a false breakout when entering a breakout setup. We hope that our 5 Key Tips for Trading Breakouts Like a Pro Trader has helped you improve.
This article focuses more in depth on one of those 5 ideas, which is trading the break of the break.
Today we will explain how you can use pattern breaks on multiple time frames to improve your odds as a breakout trader. (Video of this article is at the bottom)
Step 1: Finding the Correct Pattern
As rightfully mentioned by our partner FXStreet, a breakout trading strategy is one of the most popular methods for trading the Forex and CFD market. Yet learning how to trade breakouts properly is difficult.
The first step is to better understand patterns and understand what time frame to use (here we will not discuss all the different types of patterns in general and chart patterns in specific):
- The bad news: it takes time and experience to build up pattern recognition skills.
- The good news: luckily there is a simple short-cut.
My first tip is to simply use trend lines. Then connect the most recent support and resistance levels. More info on that in the webinar below or via our YouTube series.
My second tip is to make sure that the pattern is visible on the same timeframe. The best level of zoom is when the chart is showing +/- 150-200 candlesticks.
Here are the various scenarios that could occur:
- No chart patterns available → move on to next time frame or pair.
- A chart pattern is available but it extends back into the past → zoom out one time frame to see the full pattern on one chart.
- A chart pattern is available but it’s a very small part of the chart → zoom in one time frame to see the pattern properly on one chart.
Finding the correct time frame is where many traders start off wrong with their breakout trading system. Once you found a pattern on the correct time frame, we can move on to step 2. Here below is a relatively small but still acceptable chart pattern.
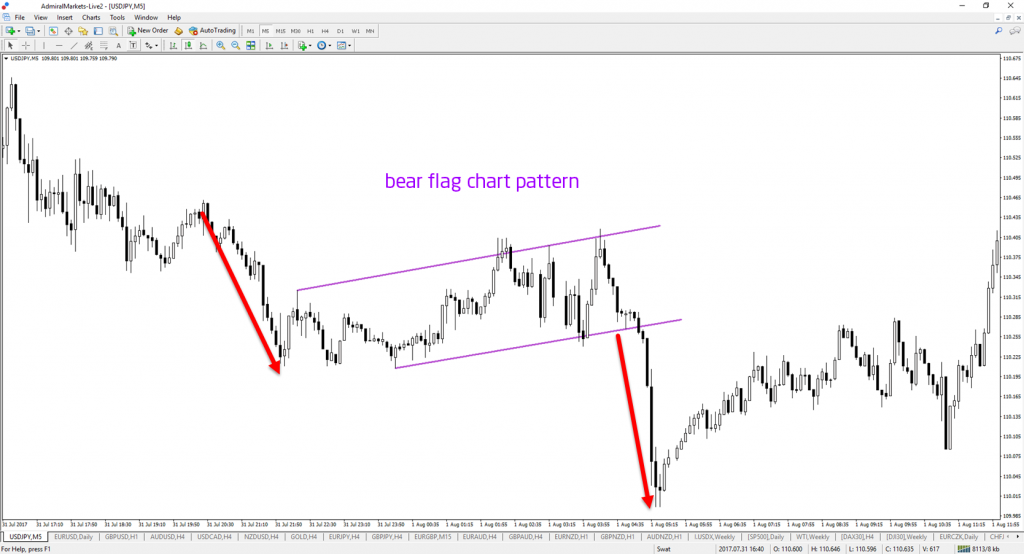
Image 1: USD/JPY 5 minute chart.
Step 2: Waiting for the Breakout of Chart Patterns
The next step is the breakout itself. Now that you have the correct time on our chart, we can wait for the actual break of the pattern.
The best method to avoid false breakouts is by waiting for a strong candle close:
- A close near the high indicates bullish control and strength.
- A close near the low indicates bearish control and strength.
Many or most false breakouts tend to show large wicks on their candle. A bullish false breakout has a wick on the candle top and a bearish false breakout has a wick on the candle bottom.
Some traders choose to trade the breakout after a strong breakout candle. This is a perfectly fine method but today’s focus is on trading the break of the break. Let’s discuss this next step.
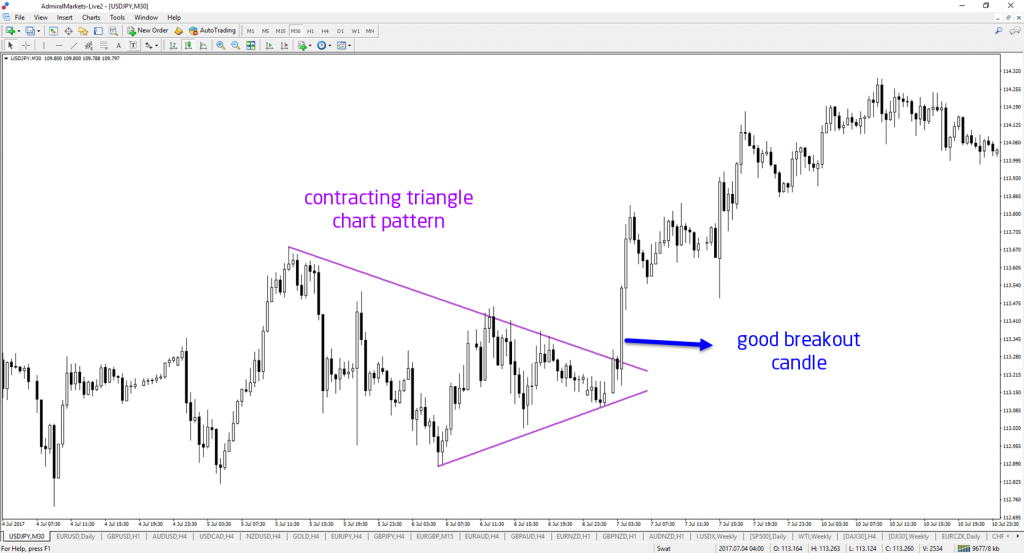
Image 2: USD/JPY 1 hour chart.
Step 3: Measuring the Breakout Point and Patterns
To trade the breakout after the pattern break, I choose to zoom into one time frame lower. So if the breakout is occurring on a 4 hour chart, then the next time frame to analyze is the 1 hour chart.
With a daily chart, it’s best to see a 4 hour chart. With a 1 hour chart, go to the 15 minute chart.
Why? Because I am able to read and understand the psychology of the market better by seeing the internal price action develop within the breakout itself.
That sounds perhaps complicated. Let me simplify it. On a lower time frame, traders are able to see the reaction after the breakout:
- Is price moving correctively?
- Or is price moving impulsively against the direction of the breakout?
Situation A: when price moves correctively, it is building another chart pattern. This indicates a strong breakout because price is is in fact building a new correction after momentum. The market is therefore no interested in the other direction. This is a continuation signal indicated by the market psychology of price.
Situation B: when price does not build a pattern after the breakout and it moves impulsively against the breakout direction, it is indicating a potential reversal and change of trend direction. It could be a false breakout or the presence of major support and resistance level (from a higher time frame). Either way, best practice is to avoid this setup.
Only when situation A appears, will breakout traders continue with this breakout trading system and implement the next step.
.
Step 4: Breakout Trading after Pattern Break
The final step of our journey in trading breakout patterns is waiting for the break of the pattern on the lower time frame.
This corrective pattern should not last too long and it should be a relatively quick pullback and breakout continuation. Anything from I think 13 candles to 24 is fine. From 24 to 36 could be ok depending on the overall market structure.
The break of the corrective pattern on the lower time frame is trading the breakout of the pattern break. So basically, this is trading the break of the break.
On this lower time frame, traders can look for a good breakout candle, a break of a trend line, a break of a fractal or use our ecs.SWAT method for the actual trigger and entry.
Waiting for the setup does take some patience but it will be worth it in the long run. I love trading breakouts by zooming in one time frame because it provides me with more exact detail and information. This in turns makes me feel more patience, plus it also provides more control over the breakout development.
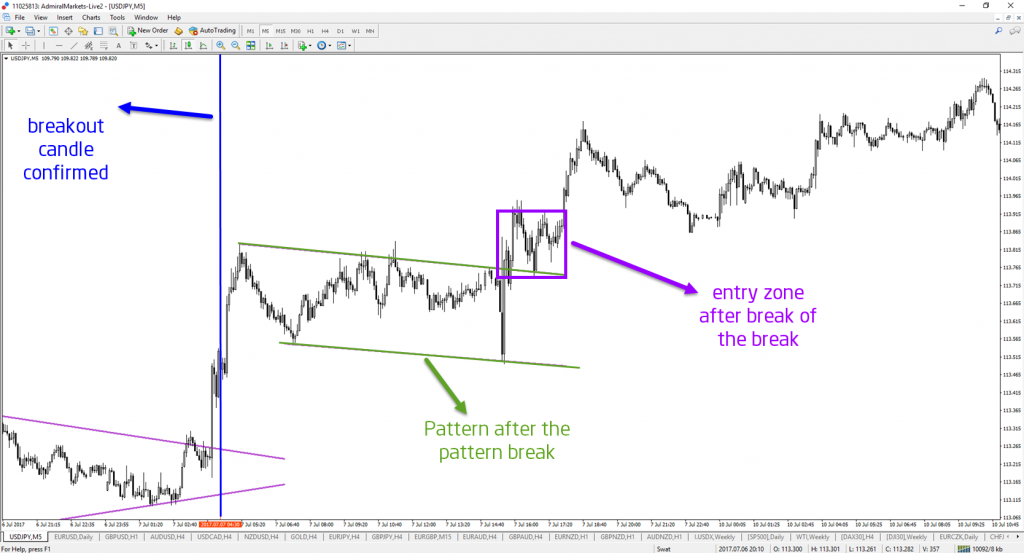
Image 3: USD/JPY 5 minute chart.
Summary Trading Forex Breakout Patterns
So remember these are the key steps:
- Find the chart pattern
- Find the correct time frame
- Wait for a breakout
- Zoomin one time frame
- Wait for a smaller pattern
- Enter next breakout
When do I enter? When do I close? Is it a good breakout? All of these problems are solved when trading with the ecs.SWAT method because the system does the measurement for you.
With the our ecs.SWAT method, trading breakouts and breaks of breaks is actually much simpler then all of the manual work mentioned in this article. The ecs.SWAT rules and indicators remove the insecurity and guess work that often traders face when trading pullbacks and breakouts.
Many green pips,
Chris
More info on our ecs.SWAT course and trading system
Twitter: @EliteCurrenSea
YouTube: Elite CurrenSea


Leave a Reply