Triangle of Analysis: Trend, S&R, and Price Patterns
Subscribe
Dear Traders,
do you sometimes feel “lost” when doing your analysis or reviewing your open trade? Or perhaps you feel insecure about your next decision?
Get ready for a step-by-step explanation how to analyse the charts and find trade setups like a pro.
This article will explain these 3 key aspects:
- Learn how to combine patterns, trends and support and resistance.
- Find out how to identify the path of least resistance in real time.
- Know where, when and how to find the best trade setups on the chart.
Analysing Charts and Price Action Like a Pro
Nenad and I always analyse the charts by combining the following 3 concepts, which we call a the ‘triangle of analysis’:
Number 1: support & resistance (S&R): Fibs at green and blue boxes indicate S&R.
Number 2: price patterns: orange and purple lines indicates corrective patterns.
Number 3: trend and momentum: blue arrows show bullish momentum and price above moving averages indicate uptrend.
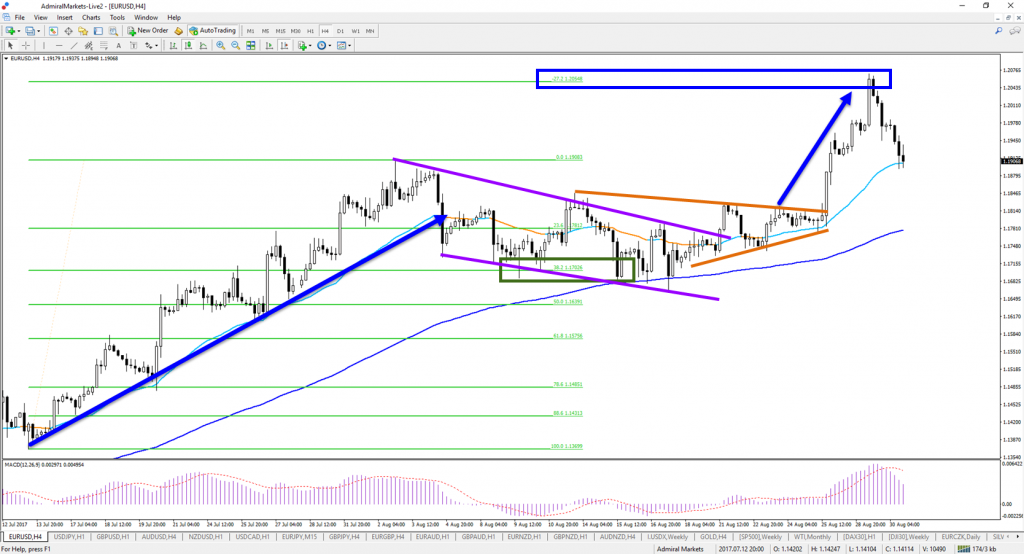
Image: EUR/USD correction (purple/orange) within larger uptrend in August 2017.
All trading systems that fail to incorporate these 3 aspects are vulnerable to losing their edge as market patterns change. In our view, traders who use our triangle of analysis are more flexible and ready to adapt their trading plan and system where and when needed.
Why?
Learn Why Triangle of Analysis is Critical
Here are the main arguments why the triangle of analysis works:
- Provides us with an objective method to analyse the charts and not get blinded by our own trading bias.
- Gives a reality check that keeps our mind focused on what the chart is really communicating to us (rather than what we hope it will do).
- Allows us to setup decision zones and apply invalidation and confirmation levels.
- Provides us with a road map how to follow price’s path of least resistance.
- Allows us to react to market movement and follow its movement rather than trying to outsmart or predict the price movement.
Trading is like dancing and traders have the role of the follower. The correct sequence is:
- The market leads
- The trader follows
Not the other way around. Yet most traders expect price to follow their analysis and predictions.
In essence, the market is speaking to us through its price action, but are you actually listening? Are you able to understand its language?
Our triangle of analysis is the best method how to learn the language of the chart.
.
Applying the Triangle of Analysis
Not everyone needs to apply the triangle of the analysis in the exact same way just like languages also differ from region to region. I will be sharing with you my main method of analysing the market structure from highest time frame to lowest time frame.
Highest time frames
Here I only review the weekly and monthly candle for its open, close, high and low. I am looking to understand whether the close was near a low or high, which indicates strength for bears (if near low) or for bulls (if near high).
Here are the main angles I review for the weekly and monthly charts:
- Direction of weekly and monthly candles.
- Check for strong bullish or bearish candle (due to strong close near high or low).
- Compare size of candle (larger candle shows more impulse).
- Check for candlestick patterns.
- Measure for break of high or low.
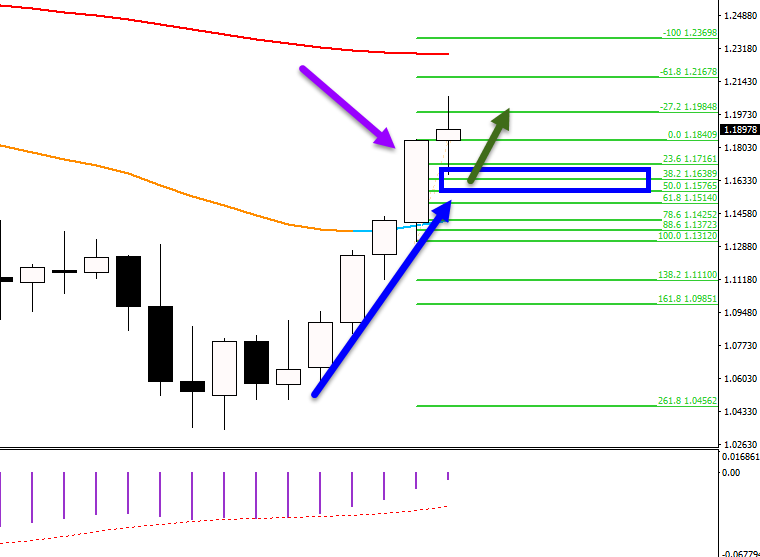
Image: EUR/USD bullish July monthly candle (purple arrow) indicates more EUR/USD strength in August, potentially after retracement to the 38.2-50% Fib (green) of the candle itself.
Daily chart S&R
On this time frame I do more complex charting than only reviewing the candle. My primary concert on the daily chart is spotting support and resistance levels using Murrey Math levels, Fractals, Fibonacci retracement levels, and tops and bottoms. I will check out the chart for any obvious wave patterns and chart patterns using trend lines.
Here are the main angles I review for the daily chart:
- S&R levels (Fibs, Fractals, Murrey Math, tops and bottoms).
- Chart patterns using trend lines.
- Obvious wave patterns.
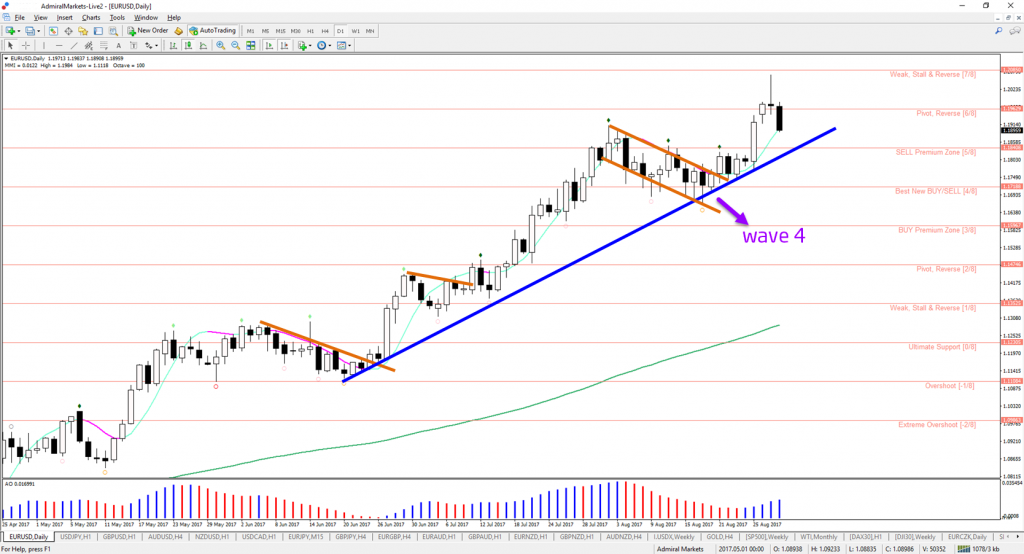
Image: EUR/USD bullish trend because price is above moving averages (MA) and short-term MA is above long-term MA. Price is breaking above corrections (orange line).
4 Hour chart Analysis
On the 4 hour chart I really expand my analysis drastically because I trade based on the 1 hour and 4 hour charts. The higher time frames are providing me with a quick sentiment of the candles, S&R and obvious patterns but on the lower time frames I do the most analysis. Most importantly I measure the trend and momentum.
Here are the main angles I review for the 4 hour chart:
- Presence of a trend: purple lines.
- Presence of momentum: blue arrows.
- Divergence patterns.
- Fibonacci and wave patterns: bounce at 38.2% and hit at -27.2% Fib target.
- Chart patterns: corrections with orange lines.
- Wave patterns.
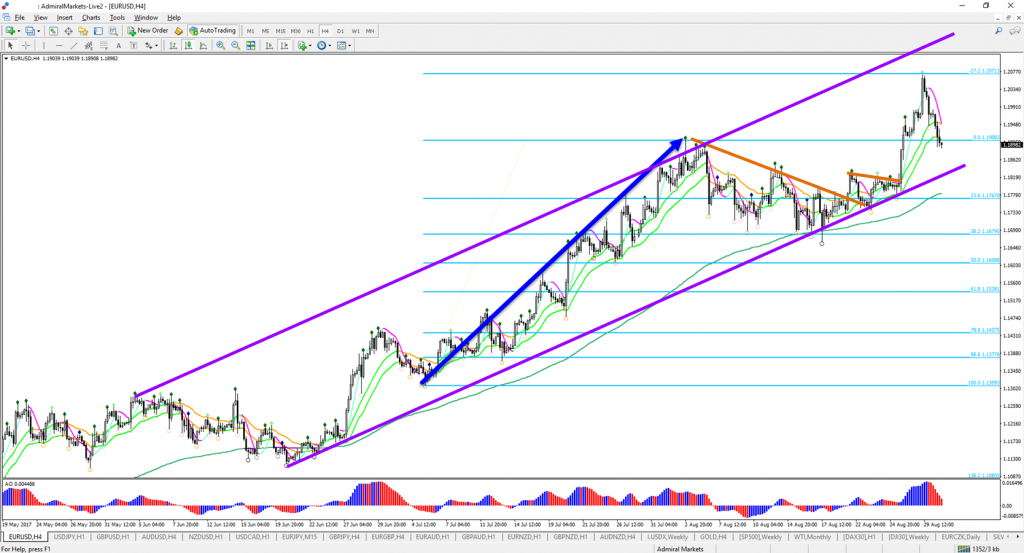
Image: EUR/USD offers bullish momentum in bullish channel. Breaks above trend lines and moving averages offer potential trade setups.
1 Hour chart and lower
The 1 hour chart and lower time frames are not used that much for analysis, but rather for “operational details” such as potential entries and exits. I check where is the expected space for the trend to continue. For instance, I will avoid taking a setup right into a strong daily level.
Here are the main angles I review for the 1 hour chart:
- Wizz levels to see if there is (wide) open space or not.
- Trend lines for breakouts and bounce.
- Moving averages for breakouts and bounce.
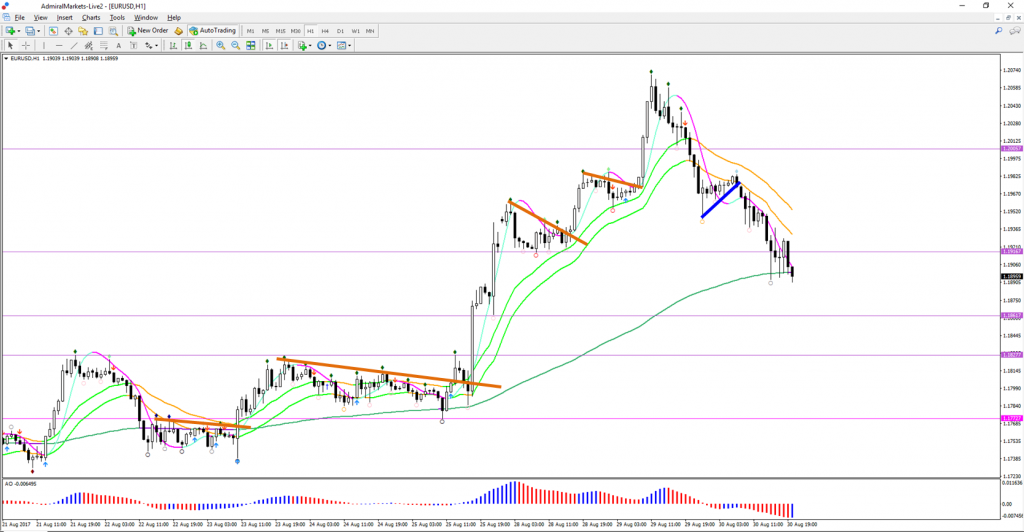
Image: EUR/USD Wizz tool showing where the space is between the purple lines.
Path of Least Resistance Analysis
When combining trend, momentum, patterns, support and resistance, I am able to make a judgment about the “path of least resistance”, which explains where price is most likely to flow with the least resistance.
The same concept is valid for a stream of water on a hill. It will also find its own path of least resistance to find the low point in the countryside like a lake. Price is the same, it too will use the path of least resistance.
Traders can estimate the likely price direction (trend/momentum), expected twists along the way (patterns), and hard rocks that will not budge (S&R) using the triangle of analysis.
Many green pips,
Chris Svorcik
More info on our ecs.SWAT course and trading system
Twitter: @EliteCurrenSea
YouTube: Elite CurrenSea


Leave a Reply