? ETH/USD Retest of Key 88.6% Fib & 21-EMAs ?
Subscribe
Hi traders,
Ethereum (ETH/USD) made a bearish bounce at the 21 ema resistance zone. The 21 EMAs again proved to be tough to break but this time price is testing a critical and key support zone at the 88.6% Fibonacci level around 410.
ETH/USD
Daily
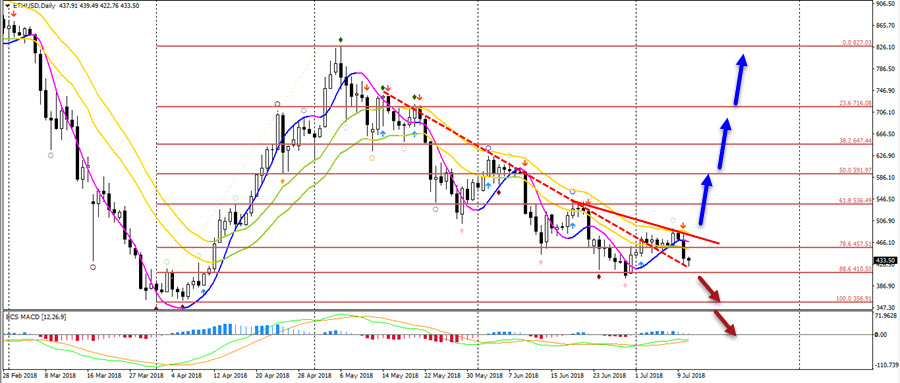
ETH/USD needs to break above the 21 EMA zone before a new bullish trend can be expected. A bullish breakout could see price move up towards the 50% Fibonacci level and perhaps further. Price is now retesting the bullish bounce at the 88.6% Fib that occurred more than a week ago. If price bounces, then a bullish break is still possible but if price breaks through the support then a downtrend continuation is likely.
4 hour

ETH/USD is bouncing at the S2 weekly pivot point support and potential head and shoulders chart pattern (purple boxes). A bullish bounce however could face strong resistance at the trend lines (red) and 21 EMA zone which is a key bounce or break zone.
Good trading,
Chris Svorcik
Elite CurrenSea


Leave a Reply