🔥 Bitcoin Bulls Not Retreating After Testing All-Time High 🔥


Dear traders,
Bitcoin (BTC/USD) is showing massive bullish momentum as expected in earlier analysis. Price action is moving away from the 21 ema zone without any hesitation.Will price action continue or will there be a pause?
Price Charts and Technical Analysis
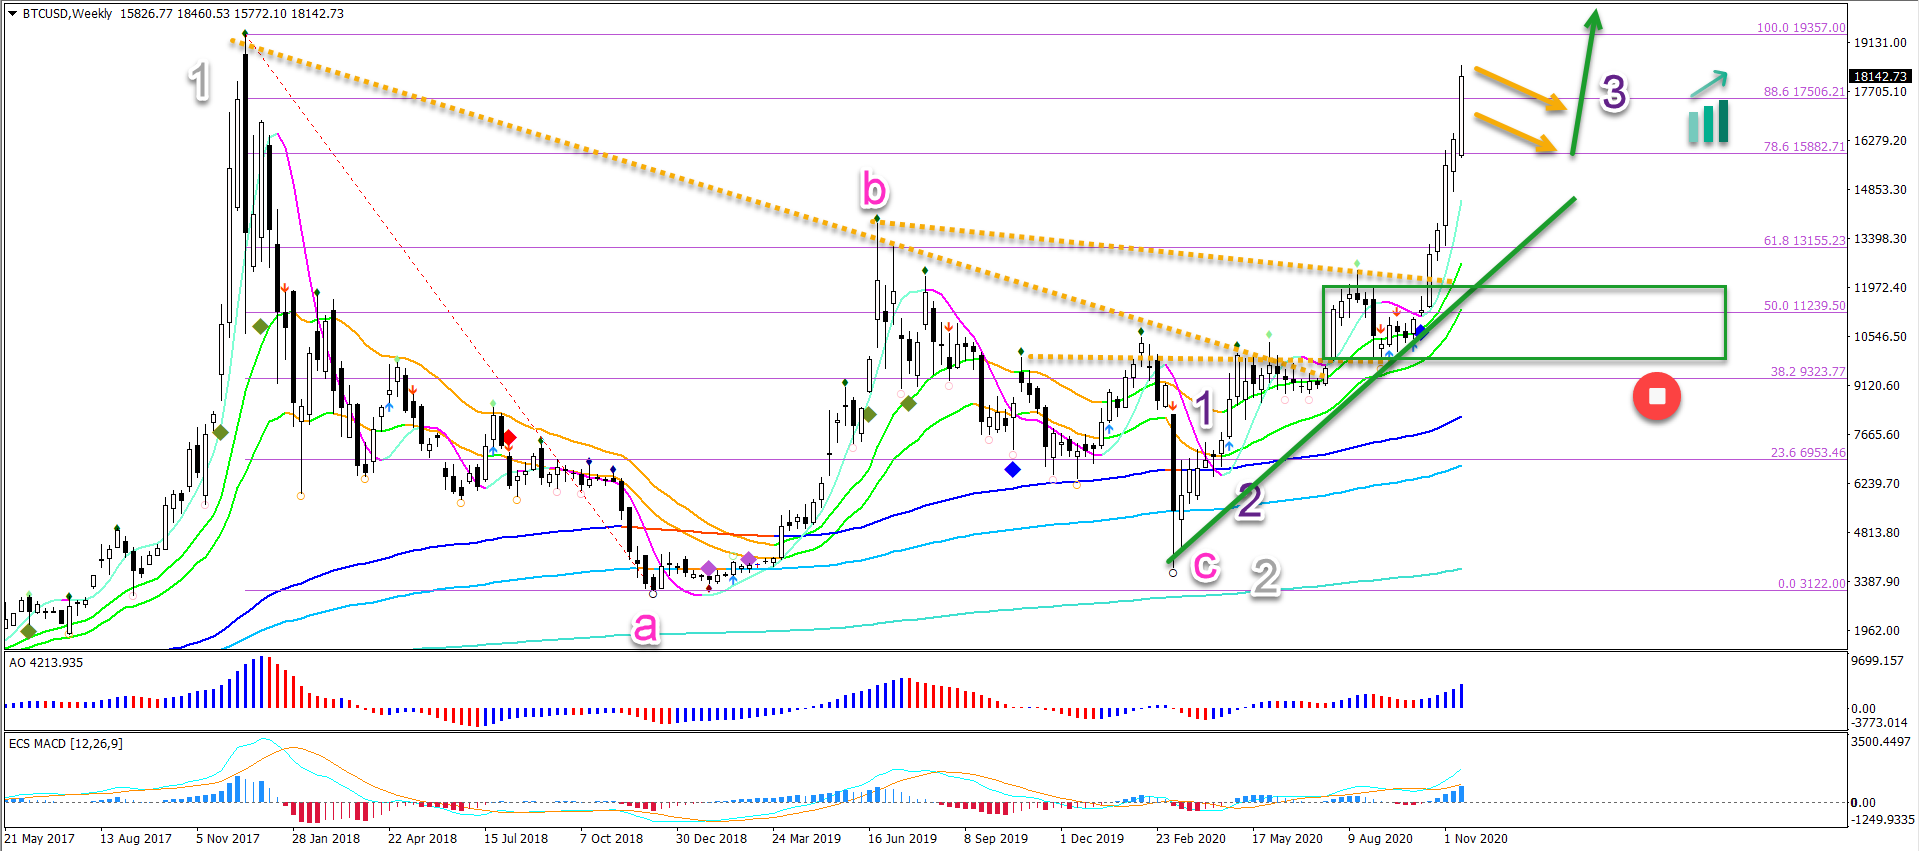
The BTC/USD rocket has broken above the 78.6% and 88.6% Fibonacci retracement resistance levels. Price action will probably test the previous top and all time high soon.
But the top is likely to stop price action for a little while:
- Some minor bearish pullback is expected as bulls take profit.
- The retracement will probably create a bull flag chart pattern (orange arrows).
- An immediate breakout above the top without a flag indicates very strong bullish momentum.
- If a flag pattern does appear on the 4 hour or daily chart (does not have to be a weekly chart), then a bullish breakout is expected.
On the 1 hour chart, price action is moving sideways. This seems to be an ABC (red) pattern in wave 4 (green).
Price action broke above the 21 ema zone and used it as a bouncing spot. Now the price is above the 21 ema. A breakout above the Fractal could indicate an immediate upside (green arrow).
A bearish breakout below the 21 ema, however, could indicate a deeper retracement (orange arrow). This could indicate an extended wave 4 (green).

The analysis has been done with the indicators and template from the SWAT method (simple wave analysis and trading). For more daily technical and wave analysis and updates, sign-up to our newsletter.
Good trading,
Chris Svorcik


Leave a Reply