Using Chart Confluence Helps Boost my Performance in Forex Trading
Subscribe
Confluence allows traders to trade with more confidence and to spot setups with a higher win rate. Certain concepts can drastically boost a trader’s performance and confluence is certainly one of them. Before I explain all of the pros and cons, let me explain how confluence works on the charts.
Confluence is when Forex traders combine various tools and instruments of technical analysis to estimate whether price movement has any trade potential. Confluence helps traders avoid the over reliance on one tool na/or indicator and any false signals generated from it.
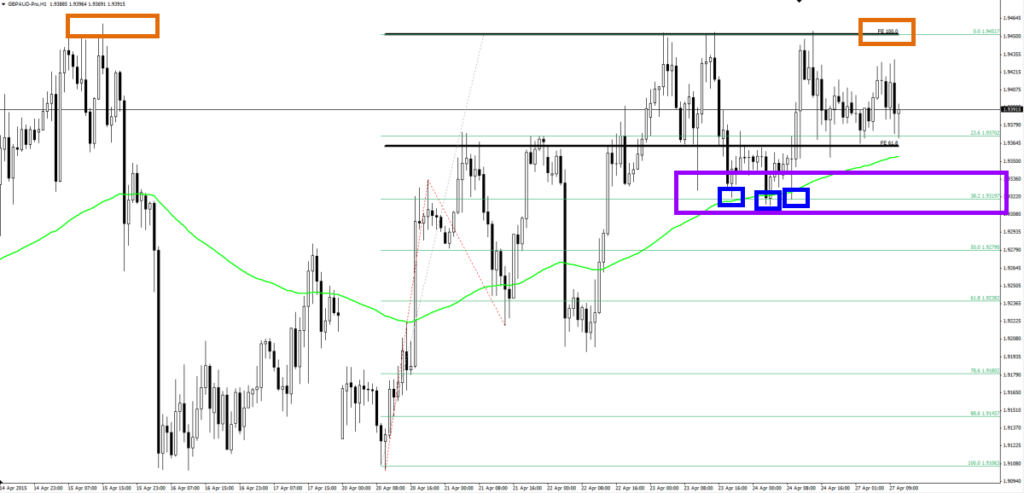
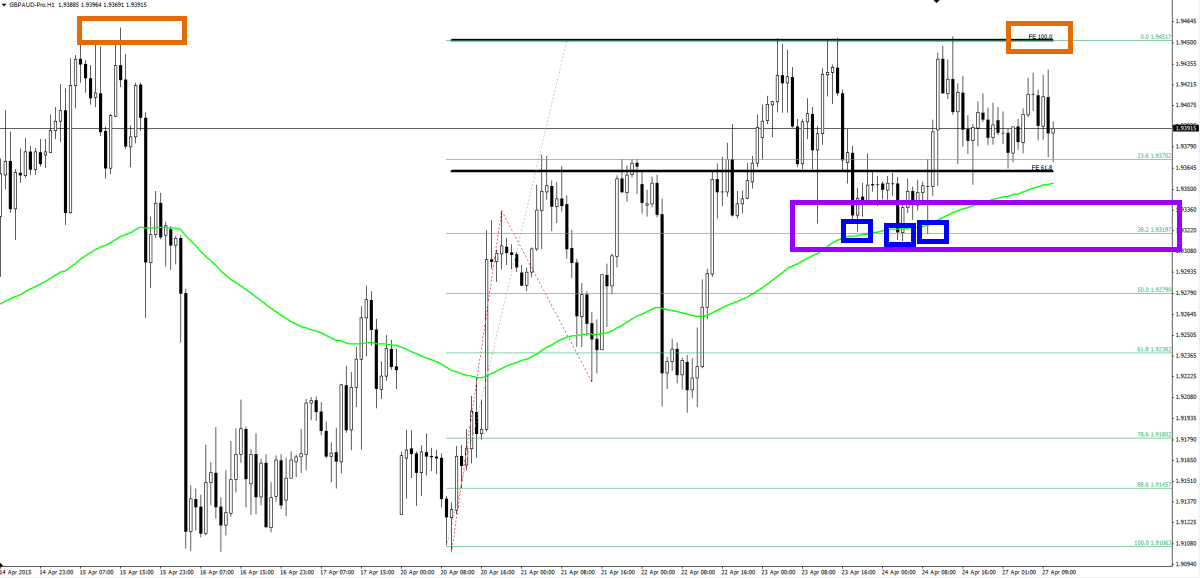
For instance, when a previous daily top and 100% Fibonacci target align themselves, then this could be a good spot to take profit or look for a reversal setup (orange square).
Or when price retraces back to a confluence of the 38.2% Fibonacci retracement plus the 50 ema moving average, then this too is an area that is showing confluence (purple square). Especially if price action is confirming the turn around with a head and shoulders chart pattern (blue squares).
By having confluence at one spot, the trader improves their ability to understand which levels are critical and worth trading. By using confluence a trader can therefore understand which setups are in fact better and which setups are actually worse. Ultimately the ability to filter out the worst setups will help the win rate and equity curve.
There are some warnings I need to give you before using the concept of confluence.
1) Realize that the price levels of reach tool and indicator can of course slightly vary a few pips so a Fib at 1.0820 and a moving average at 1.0825 are still showing confluence despite the difference of 5 pips. However, the lower the time frame, the less difference there should be otherwise the confluence loses importance.
2) Be careful with over combining time frames, overcrowded charts, and excessive filtering of setups. A trader does not want to have paralysis of analysis.
3) Use a balanced number of tools and indicators and use tools and indicators that are (a bit) diverse. Using 2 of the same type of tool or indicator will not help your analysis.
4) A good rule of thumb is to find 3 reasons to take the trade and 0 reasons not to take it.
Check out my webinar this week Thursday at Admiral Markets on tools and indicators at 18:00 pm CEST (16:00pm GMT) – go here.
Many green pips, Tarantula FX


