Chart Confluence Boosts Fibonacci Trading (part 12)
Subscribe
Fibonacci is a great tool for establishing entries and exits, for filtering out bad setups, and for analyzing & charting.
But at times Fib trading might be(come) confusing due its multiple methods and options how to apply it (discretion).
To master the art and science of trading the Fibonacci levels, traders must build up and acquire 2 vital elements: sufficient experience and even more experience.
Experience comes with practice and time BUT there is a “short-cut” for those that are starting, struggling or looking to improve:
Locating confluence on the charts!
CHART CONFLUENCE
Chart confluence is when multiple tools and methods confirm the importance of 1 particular price level.
Why is this important?
By finding Fibonacci confluence, traders advance their accuracy, improve their confidence in setups, and speed up the learning curve. Let me explain.
A) Accuracy: there is a higher probability that price will react to a level when there are multiple tools indicating its importance.
B) Confidence: the improved odds of a trader’s success in turn helps traders keep their confidence high. This in turns allows them to implement the trading plan (rules) as planned.
C) Learning: traders can learn more and quicker when correctly implementing their trading plan. They also develop a better discipline, which is critical for achieving trading success.
FIBONACCI CONFLUENCE
Traders can locate Fibonacci confluence by either using multiple Fibonacci tools or by mixing Fibonacci with other tools and indicators. The Fibonacci tools can provide confluence on the same time frame (2 or more Fibs on 1 time frame) AND also on multiple time frames (Fibs on 2+ time frames).
Multiple Fibonacci levels:
1) Fibonacci retracement and a Fibonacci target: this is when a retracement and target line up at the same price. This occurs when there is a trend and the correction occurs in 3 legs/swings. The 3rd leg of the correction takes price back to the target and the retracement.
2) Multiple retracement levels: this occurs when placing the Fib tool on 2 or more swings of the same time frame or using Fib levels on multiple time frames.
3) Multiple targets levels: this occurs when placing the Fib tool on 2 or more swings of the same time frame or using Fib levels on multiple time frames.

VIDEO EXAMPLE
Here is video with some great examples.
Check out our Youtube channel with great content: https://www.youtube.com/channel/UCpimDN3XJ9Pg6ML9UALlLOg
FIBONACCI & OTHER TOOLS
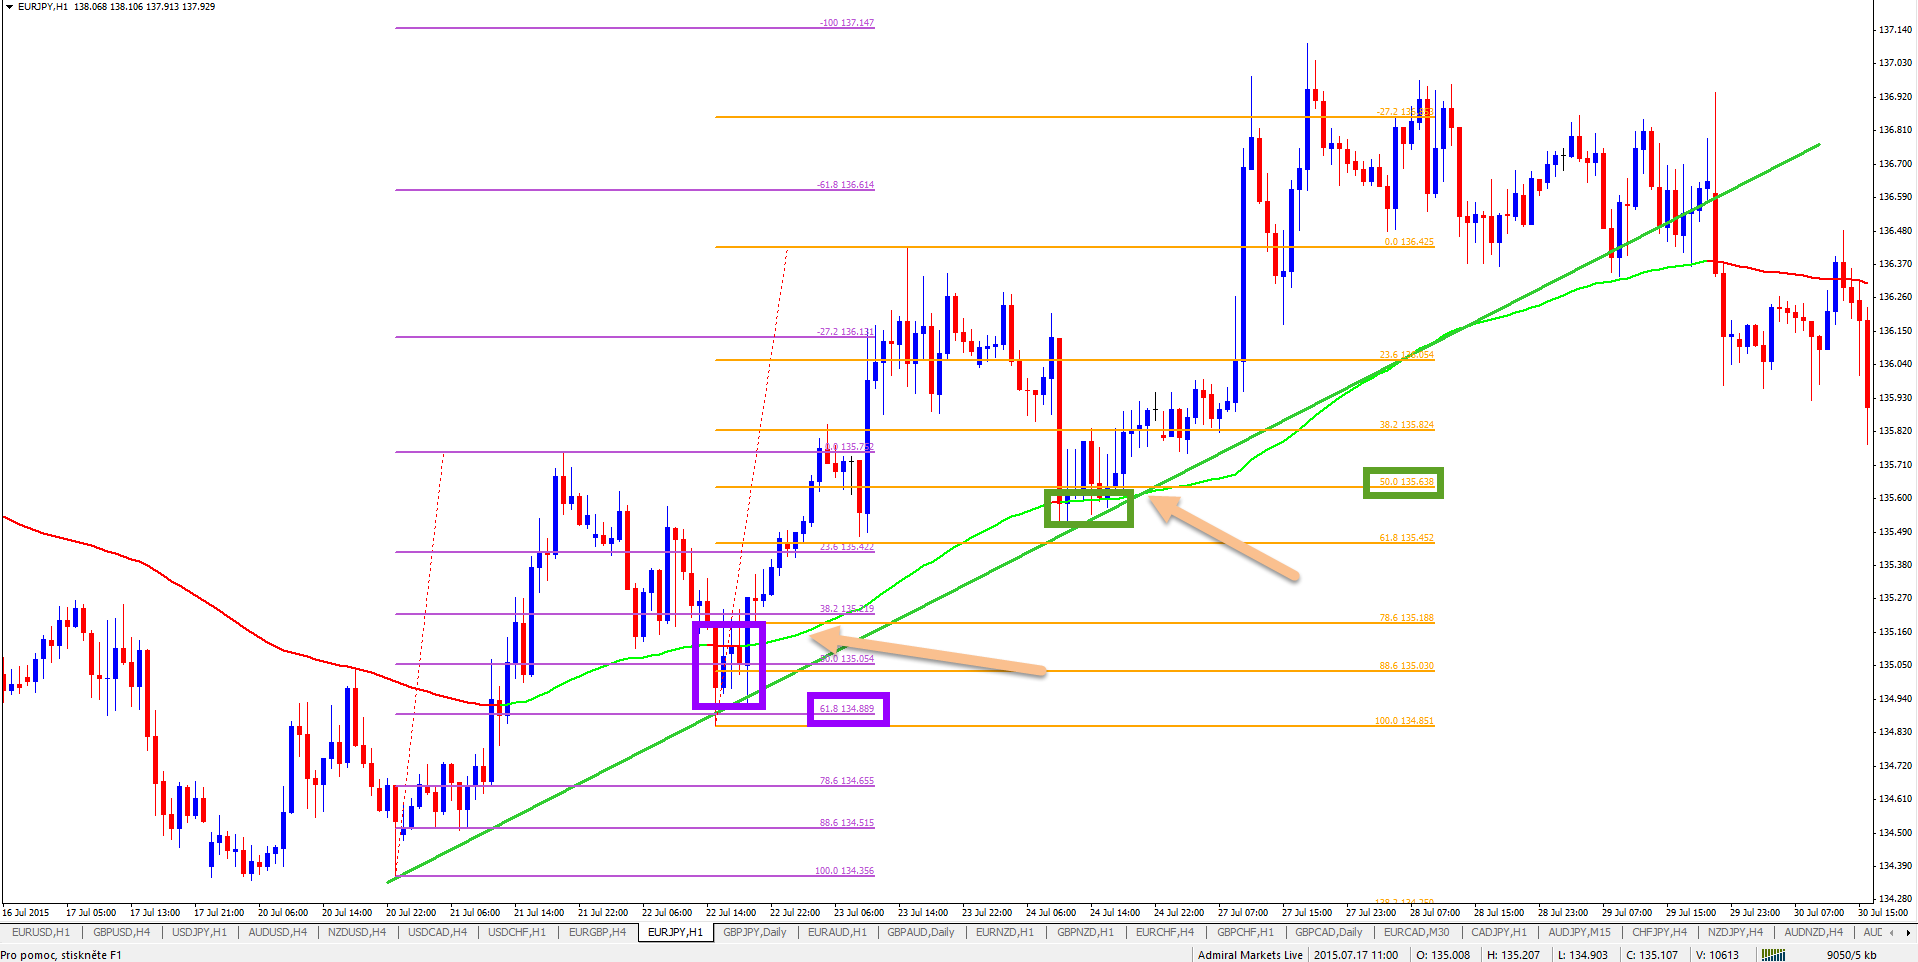
Fibonacci levels with other tools and indicators:
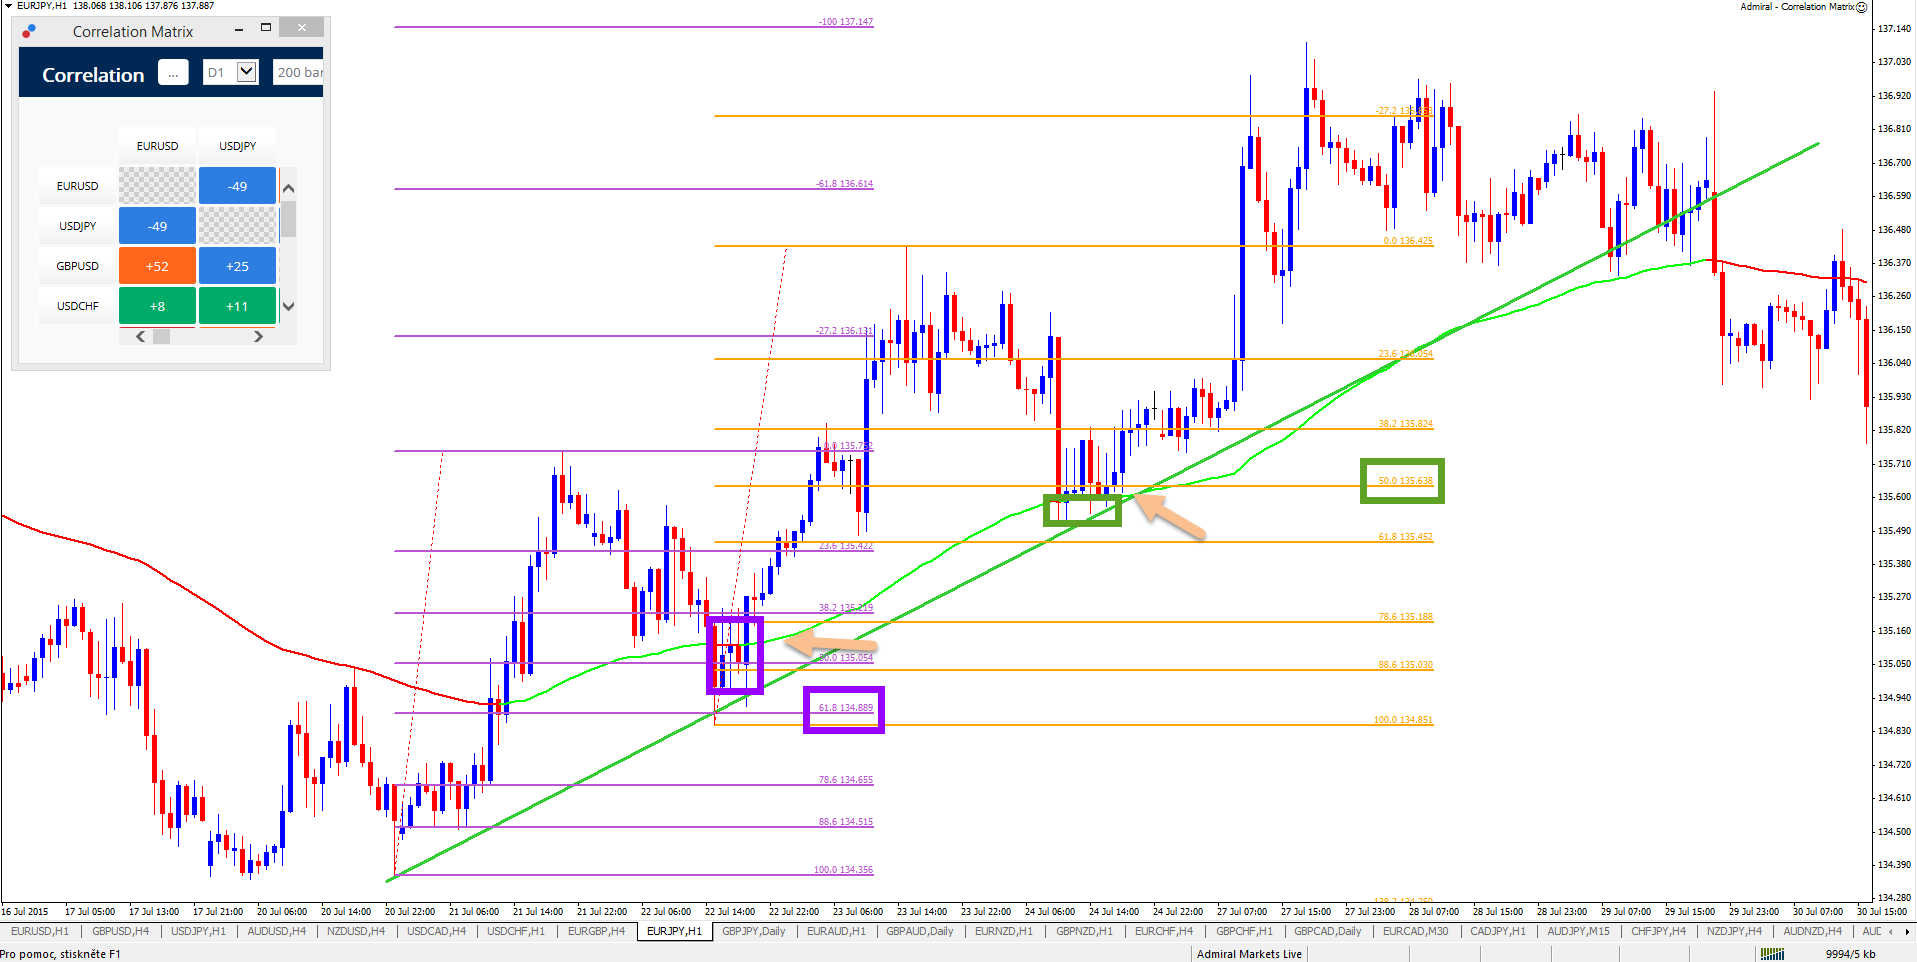
1) Fibonacci with candle sticks (purple): using price action at Fib levels. In this case traders wait for a candle stick pattern to occur at the Fibonacci level instead of “only” anticipating a price reaction at the Fib. The candle pattern confirms the response of the market at the Fib.
2) Fibonacci with support and resistance (green): the more reasons or confluence at 1 level, the stronger this level will typical behave and the more likely that price will bounce at the support or resistance. Let’s say that, besides a Fib retracement level, price is also at a trend line and daily bottom. These 3 factors create a strong zone, which has a higher chance of impacting the market compared to ONLY having the Fib level.
3) Fibonacci and moving averages (light orange arrows): these two tools work well together because Fibs are most effective in a trending environment. Fibonacci levels tend to be respected in a trend but can be ignored in a range. First of all, using moving average helps determine if there is a trend. Second of all, moving averages also act as a support and resistance in a trend, which means that a moving average adds confluence to a Fib level.
Before leaving, make sure to read our entire Fibonacci series!


Leave a Reply