Is It Worth Learning Wave Patterns?
Subscribe
Dear Trader,
people seem to either love or hate Elliot Wave theory. Some argue that it is a complete waste of time because it appears subjective, while others are devout believers/practitioners.
So which opinion is right?
This article will discuss the pros and cons of engaging in Elliot Wave analysis.
Why are wave patterns of interest and how can it help with trading?
Well-executed Elliot wave analysis potentially offers a unique advantage for market forecasting. It can provide surprisingly accurate future price predictions if the historical price patterns can be analyzed and labeled accurately. Therefore it can lead to a substantial advantage when making trading decisions.
However a sloppy wave analysis can quickly lead into troublesome territory, just as a good wave analysis can appear like clairvoyance at times.
The main benefit I see in wave pattern analysis is that it provides a way of locating current price-action within a larger framework, and therefore offers a kind of birds-eye view of the market that is otherwise difficult to attain. Knowing where price is at in the greater scheme of things has obvious benefits, such as helping to define realistic targets and stop loss settings, and predicting how long a trend might last.
How does it work?
In order to understand how Elliot Wave theory uses historical price movements to predict the future, we have to briefly cover two concepts, i.e. momentum and the fractal nature of price-action, which are two of the most critical elements of wave pattern theory.
Momentum
Momentum is simply the relative strength or weakness of a price movement. The more momentum behind an up or down movement, the faster price will proceed in that direction without hesitation. When momentum is weak, price starts moving more sideways because it takes more time for price to move significant amounts of pips.
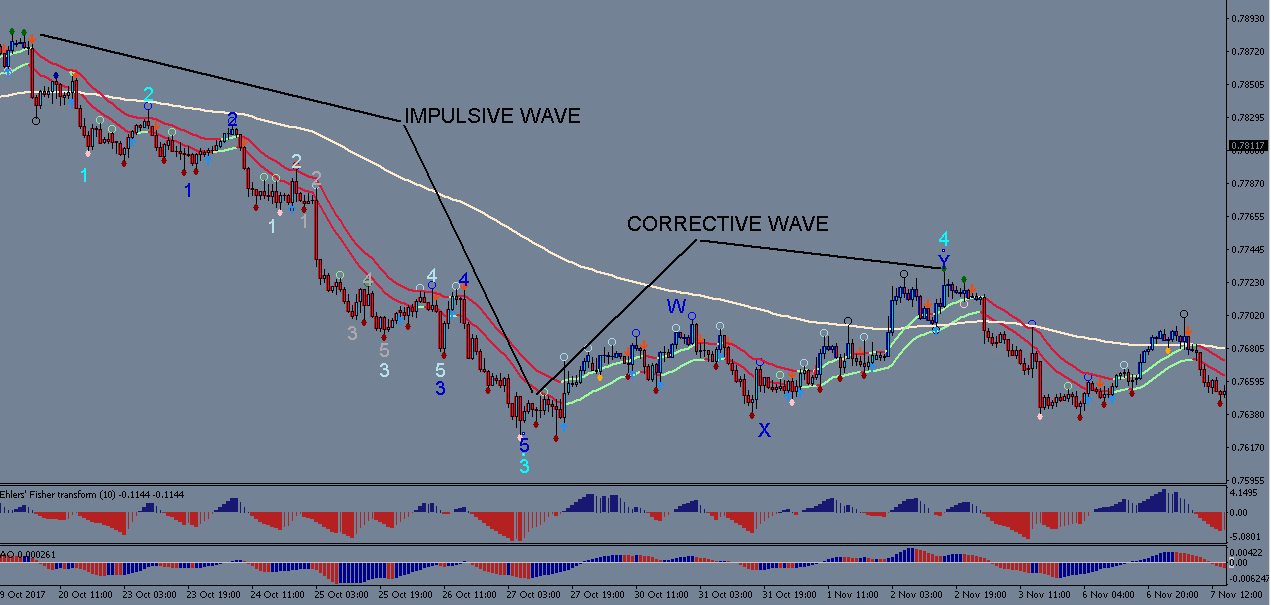
Price movements are in essence a reflection/representation of the collective market psychology. To put it simply, when market players feel the same way about a financial instrument, price patterns will reflect this in the form of clear and strong move in one direction (impulsive momentum). But when investors have opposing views, price can’t move up or done very easily and therefore creates choppy sideways movements (corrective momentum).
Elliot Wave analysis tries to maps these changes between impulsive and corrective price-action and define them in a meaningful way. The people who developed wave pattern theory saw that these changes in momentum occur in repeating patterns (i.e. in a series of waves or swings). Impulsive and corrective moves take turns and together form a larger overall wave pattern.
This, again, can be explained very simply via investor psychology. Some event happens that makes a lot of people feel the same way about a currency pair for example… price starts to move impulsively in one direction. But after a while some people close positions and take profit. But of course not everybody will do this at the same time. People who believe that the value of a currency is still too low/high, based on their fundamental or technical analysis, will keep their positions open and in fact may want to add more positions in the same direction when price begins to retrace due to the closing of positions of other market players. This is when corrective sideways momentum sets in. Eventually one side (the bears or bulls) will regain the upper hand and price proceeds impulsively in one direction again. And thus goes the eternal cycle of wave patterns.
Fractal nature of price-action

These wave patterns are in fact observable on every time scale. A wave pattern on a larger scale is actually comprised of several mini-structures of the same type when looked at on a smaller time frame. Hence they are fractal in nature. The ECS.SWAT course covers this concept in more detail.
Elliot wave researchers have mapped these repeating patterns over time through much lengthy observation and correlation. This has led to defining a fairly clear set of ‘rules’ by which to label and segregate price moves into distinct patterns.
The main task for any Elliot wave analyst is to apply these rules and guidelines accurately so that future price moves can be predicted with a high likelihood. This is unfortunately the area where a lot of wave analysis out there fails to deliver.
Limitations of Wave analysis
There are quite a few wave pattern permutations that can appear. Without a very thorough and detailed look at the micro-structure, it is easy to mislabel price patterns in an overly simplistic manner. It requires a lot of experience to be able to discern subtle differences within wave patterns that can make a big difference in the overall analysis. Corrective patterns are especially tricky to label accurately because they can be much more complex than impulsive patterns.
Another limitation is that wave pattern analysis can only ever suggest a likelihood of what is to come next, but there is always the possibility of an alternative scenario playing out as well.
It is therefore very important to develop an experience-based knowledge that allows the analyst to discern between times when price-action is offering a strong bias for a particular future scenario, and times when the probabilities are too balanced, such that it is impossible to make sound trading decisions based upon one or the other scenario.
The key lies in waiting for price action to offer enough confirmation for a certain scenario to become more likely and only make trading decisions when such a bias exists.
Aids for wave analysis: Moving averages and momentum indicators
There are some tools that can assist with defining wave patterns. A short term and long-term moving average can be very helpful as additional references because price will interact with the moving averages in different ways, depending on what type of wave pattern is unfolding.
Momentum indicators, such as the Awesome Oscillator or Fisher, are also useful for wave analysis because each wave pattern is associated with certain kinds of momentum readings. These indicators can therefore provide another type of validation for wave counts.
The SWAT system from Elite Currensea incorporates these tools with wave analysis because they provide a very clear sense of the overall price structure when used together.
Conclusion
In my opinion, wave analysis is a fantastic method to better understand overall market structure and therefore to make better trading decision, as long as it is applied with precision. This skill takes time to develop but it is no doubt a worthwhile endeavor.
All the best along your trading journey
Hubert
.


Leave a Reply