Risk Management Remains Key for Protecting Your Trading Capital

Dear traders,
Have you gone through the pain of seeing your trading account drop by half or more in just one single loss?
Risk management is the number one factor for defending your trading capital. In essence, it allows traders to keep trading. Your trading capital is like the inventory of your retail shop. If you have no goods to sell, then you will be out of business soon.
This article explains why protecting the trading capital is essential for any trader. It emphasizes that the number one goal of any trader at any given trading day or week is to make sure that they can trade another day.
Think About Risk First, Before Profits
Their first goal is not to make money, but to limit losses. Always think about risk first before aiming to make profits.
The market is volatile and any trade can end for a win or loss. This is valid for ALL setups, even if your strategy says that a particular setup has a high chance, for instance 80% of winning.
Although people are hardheaded to believe that a setup with 80% win chance can actually still turn into a loss. The reality is that 2 out of 10 trades will be a loss.
The unpredictable nature of the market means that traders should never, ever risk their entire trading capital on 1 trade setup. This is even more important for traders that are using leverage*, which is a normal approach when trading. If they do use their capital for one setup, then there is a high chance that immediately or eventually one losing trade will lead to the loss of the entire account (or even more).
(* leverage means that a broker or bank is temporarily providing you access to more capital. A leverage of 30:1 means that traders can use 30x the size of their capital. If you are trading with 5,000 euro, then traders are in effect trading with 30 times 150 is 150,000 euro.)
Traders can defend themselves by:
- Using stop loss: using a stop loss for each trade setup
- Max risk per setup: limiting the risk on each and every setup.
- Limiting draw-down: keep the draw-down (series of losses) as small as possible.
The above measures are especially important for leveraged trades. If you are ONLY risking your own capital, then one could exchange a larger part of their capital (base currency) for another currency without losing it all (unless a currency has a default).
Using Stop Loss
The stop loss is the exit point where traders accept a loss. Traders are tempted to avoid losses and hence not use a stop loss but they run enormous risk. Without a stop loss, traders are in fact risking their entire trading capital and more.
Many traders misunderstand the purpose of the stop loss. It is not to protect the trade setup… It is to protect the trading capital.
That said, traders do want to use a technical spot for their stop loss to avoid taking unnecessary losses. Losing trades is unavoidable but finding a technical spot for the stop loss will help the survival odds of a trade setup.
Although the best approach is to use a technical spot, this will mean that the stop loss size will vary from setup to setup.
The stop loss size is the distance between the entry and the stop loss. It indicates the taken risk if traders use a fixed lot size.
Elite CurrenSea however recommends using a fixed risk per trade. When using a fixed risk, then the lot size is irrelevant.
This is a misunderstanding that traders often do not realize: a larger stop loss size does not translate into a bigger risk if traders adjust their lot size. Here is how the math works.
Fixed lot size approach trading EUR/USD with for instance 2 minis (0.2 standard):
20 pips → +/- risking $40
50 pips → +/- risking $80
100 pips → +/- risking $160
Fixed risk trading EUR/USD with 1% risk per trade (1% of your trading capital). For instance, risk 1% of $5000 is $50.
20 pips → 2.5 mini lot size → +/- risking $50
50 pips → 1 mini lot size → +/- risking $50
100 pips-→ 0.5 mini lot size → +/- risking $50
With a fixed risk per trade, the stop loss size impacts the lot size but the risk per trade, which remains constant regardless of the stop loss.
Traders who apply a fixed lot size will have an incentive to use a tight stop loss in order to reduce the risk. But that could come at the disadvantage of not placing the stop loss at technically the optimal or best level. This in turn will it make more likely that price will hit your stop loss and take your trade out for a loss.
Traders who apply a fixed risk per trade will have an incentive to use the best or optimal (technical) stop loss level rather than a tight stop loss. The only difference is that the lot size will vary from setup to setup, which takes some time to calculate manually or via software. The process works as follows:
- Know the risk per setup
- Find the technical and best place for the stop loss
- Calculate the difference between entry and stop loss
- Calculate the lot size based on 0. and 2.
There are also tools that help calculate the lot size automatically.
Max Risk Leverage Per Setup
The risk per setup should be limited but by how much. Is 25% per trade ok or is 10% too much?
The golden rule is not to trade with more than 5% per risk per trade. Anything more than 5% per setup is considered to be gambling.
Granted, you will probably have better odds of gambling in the Forex than in the casino, but if you want to approach trading with a professional and long-term approach, then limiting the risk to max 5% is key.
The 5% risk per setup means that if you have a capital of $5000, then you will choose a lot size and stop loss size where you will not lose more than $250 per trade (5%of $5000).
The 5% risk however is only recommended for high risk traders. In fact, 5% risk per setup is considered to be a risky approach. But it is within the margins of what is tolerable. This 5% approach however means that losing your trading capital is still more likely. The main benefit of 5% risk per setup is for traders who want to build up a small account fast and who are fine with losing that account.
A more conservative and balanced approach recommends using a risk percentage of 1-2% per trade. If you risk 1% per trade, then the chances of losing the trading capital have been significantly reduced. Even if you were to lose 5 trades in a row, then the max you have lost is 5% of the original capital. This is much less than losing 25% (5 trades * 5% risk).
Beginning traders could even be better off to trade with 1% risk per setup or even less than 1% risk. Trading with 0.25 or 0.5% is a much better starting point for training purposes.
The main benefit of risking smaller amounts is the effect on your trading psychology. The less risk you take, the more traders can focus on the trading plan rather than on the risk. A high risk will distract you as a trader. It will make you feel fear, nervous and anxious. All you care about is the profits you make on that one single trade but you neglect your trading plan. The problem is that 1 trade setup is never a guarantee. A trading plan is needed and important to make profits in the long run. High risk trading keeps your attention away from your trading plan, which is actually the path that leads to long-term success.
When trading with low risk per setup, traders will focus on the trading plan and the long-term profitability. They will not set aside their trading plan rules because they are trading with a risk percentage that does not make them fearful.
Your Personal Risk Style
From this perspective, knowing your risk personality and establishing a risk profile that suits and matches your trading style is important:
- A risk taker will feel bored if the trade setups use too little risk
- A conservative trader will feel nervous if the trade setups use too much risk
A trader must weigh his risk personality, trading goals, and experience to find a risk management style that matches his or her short and long-term objectives.
Goals and account size matters too because a trader with a small trading account could prefer to take more risk per setups in an attempt to build the account quicker. Someone with a $500 or $5,000 account might not want to withdraw their profits from their trading account and might prefer to keep the profits instead so that the account grows quicker to for instance $1,000 or $10,000. Compounding will make this process go quicker as well if the strategy and results are positive, of course.
Other traders might have larger trading capital, like $25,000 or $50,000, and prefer to withdraw their profits regularly, like on a monthly basis. If they earn 10% in a month, then this could equal to $2,500 or $5,000 and these traders might prefer to cash in and remove those profits from the trading account.
Last but not least, traders should not over-use leverage and be very careful of over-leveraging their account. But if you adhere to a risk management plan, use a stop loss for every trade setup, and limit the risk to 1% risk per trade for instance, then you should not bump into any problems with leverage. Leverage indicates the capital that is being borrowed from the broker or bank to buy and sell financial instruments.
Traders who risk a lot per setup need to be aware that they are probably using a high leverage. The danger of that is when the price goes against your position and the available margin starts to decrease. The available margin indicates whether you have sufficient capital in your account to maintain the open trade setups. If you run out of margin, the broker or bank will do a margin call and they could either call you to add more capital and/or close your open trade positions to limit their own risk.
Traders who trade with limited risk like 0.1-1% should not run into problems with leverage if they stick to 1-2 setups at a time. Of course, a trader who opens up multiple trades or more at the same time could face margin problems even if their risk per setup is limited because the total risk still adds up to a substantial risk.
Limiting Draw-Down
The number one method of keeping the draw-down (DD) low is by using a small risk per trade. The draw-down measures the dip of your trading capital from highest point to lowest point. The ups and downs that your trading capital make via your wins and losses is called “equity curve”.
- A positive sloped equity curve means that you are consistently making more money with your wins than losing money with your losses.
- A negatively sloped equity curve means that you are consistently losing more money when you lose than making money with your wins.
Of course, most equity curves are not only up or down. They move up and down continuously. But the equity curve slope (up, down or flat) does indicate whether a trader is profitable in the long run or not. The draw-down measures how the account goes down before it moves up again.
Let’s review this example: you start with a $5,000 account, which is 100%. In the next 10 trade setups (each risking 1% risk per setup), you won 7 trades and lost 3:
+ 2% Running total: +2%
+0.5% Running total: +2.5%
+1.5% Running total: +4%
-1% Running total: +3%
-1% Running total: +2%
-1% Running total: +1%
+0.2% Running total: +1.2%
+0.5% Running total: +1.7%
+5.5% Running total: +7.2%
+3% Running total: +10.2%
Total profit: 10.2%. What was the draw-down in this series of trades? We would always look for the largest negative series. In this case, there was only 1 set of trades where the equity curve went downwards. There were 3x losses in a row (total went down from +4% to +1%), which created a draw-down of 3%. A draw-down can happen whether the account is in positive or negative territory.
Furthermore, a draw-down can also occur even if a winning trade disconnects a series of losses from each other. Here is another example:
+1% Running total: +1%
+0.5% Running total: +1.5%
-0.8% Running total: +0.7%
-1% Running total: -0.3%
+0.5% Running total: +0.2%
-1% Running total: -0.8%
-0.5% Running total: -1.3%
+3.5% Running total: +2.2%
+2.5% Running total: +4.7%
+1% Running total: +5.7%
Total profit: +5.7%. What was the draw-down in this series of trades? Perhaps you think -1.8% because the two sets of two losses were interrupted by a win. But in my definition, the low point was not yet reached so I consider the set of 5 trades (4 losses and 1 win) to be part of the draw-down. The draw-down therefore was -2.8% (the total of those 5 trades).
The second best way to keep the draw-down limited is to use a fixed risk per setup or if you do vary the risk per setup, then it’s best to keep the risk low on all setups.s. Although Nenad does vary his risk per trade, his overall risk is small and he has a lot of experience in handling this approach. For most traders, it is best to risk the same risk percentage on each setup. That way, you don’t lose more on your losses and win less on your wins. The problem with varying your risk per trade is that you could win a trade when risking 1% but lose a setup when risking 3%.
Generally speaking, the lower the risk and volatility of your account, the better it is for your trading performance. The more volatile your equity curve is, the more return you need to make to justify that risk.
A low draw-down is essential (what is low depends on your risk personality). If traders start to show large losing streaks, then often they become nervous and fearful that they will lose their trading account. The trading psychology becomes negatively impacted and this leads to a spiral of doom (more risk leads to more risk, which leads to losing the account).
The best approach is to compare your total gain with your draw-down. If you are risking a lot to make a little profit, then this is a very risky approach. If you are making little, but risking less, then this is in fact more desirable. Let’s provide two examples:
Method A: +25% profit, 40% draw-down
Method B: +20% profit, 20% draw-down
Which method is better?
Many traders would choose method A because it provides them 5% more profit. However, if you take into account the risk involved, then method B is a much better choice by a long distance. Method manages to make 20% with 20% draw-down, which is a 1:1 ratio. Method makes +25% but with 40% risk (draw-down), which is 0.62 ratio. Method A is much better as the risk (draw-down) is much more tolerable.
A good rule of thumb is to realise that the profit target you have in mind for a year is equal to the draw-down level that you should expect in a year too. Experienced traders will be able to gain (much) more than their draw-down but it is a good rule at the beginning.
Another approach could be to consider what draw-down levels you could manage to handle as a trader. Some traders are conservative and prefer not to lose more then 5% of their trading capital. Others are fine with 10, 20, 30, 40, 50, 60 or even 70% draw-down levels.
Keep in mind that the draw-down that you think you can handle is in reality a lot more difficult to handle in real live trading. So if you have never experienced a draw-down, then always start with a low draw-down first to see how that works out for you. Depending on that experience, you can increase or decrease it. A rule of thumb that could work is to take the draw-down that you think is fine for you, and then reduce it by 50%. So if you think that you could handle 20% draw-down based on your assessment of your risk personality but you do not have any experience in this area, then try 50% of 20% first, which is 10% draw-down.
Based on this maximum draw-down, a trader could calculate the risk per setup. If a trader does not want to have a larger draw-down than 10% of their trading capital, then they can divide this 10% with their max expected or historical losing streak. If a trader looks at their trading statistics and sees that the largest series of losses was 8 units of reward to risk (1% risk per setup means 8% loss), then a trader could trade 1.25% (10/8) risk per trade and expect to stay within the 10% draw-down limits in most cases. It is useful to have a buffer just in case but the rule helps provide an idea about risk.
Let’s use another example where a trader is willing to accept 20% risk. His largest drawdown streak is 10 units of reward to risk, which means that they could trade with 2% risk per setup (20/10) and still stay within the 20% draw-down limit.
If you are not sure whether your expected losing streak is tested sufficiently, then it is good to use a more cautious number. If the current losing streak is 10 but your testing period has been quite short (only 1 year of back testing for instance), then assuming a value that is twice as high is a good safety measure. In that case, traders could consider trading with less risk per setup, just in case.
Account Management
Traders should never ever borrow (loan) money to engage in trading. Trading financial markets must always be done with surplus capital that can be lost without affecting your lifestyle in any way. This is very important because traders must focus on following their trading plan rather then chasing profits. If you feel that you must win so you can earn money to buy essential goods, then you will make bad trading decisions due to this pressure. Only risk what you can lose.
You must choose a percentage of your capital that you can handle losing if the entire capital was lost. And in a certain way, traders should kind of expect that the trading capital will be lost once they engage in trading. What percent you choose to dedicate to trading depends on your risk appetite. The lower the percentage, the least risk a trader is taking. Of course a trader who risks 1% of their total savings has less stress than someone who risks 25% of their savings in their trading account. Houses and other assets should not be counted towards savings and we are only talking about liquid assets.
Once you have chosen a trading capital that you feel comfortable with, then you can decide if you want to open one trading account or perhaps multiple ones. If you are trading with a small account, then probably choosing one broker or bank is sufficient. If you are trading with larger sums, then opening up two or more accounts and spreading the capital and risk makes sense. You can check the financial authorities where the broker or bank of your choice is located to see whether your deposit is insured against bankruptcy and if so, till what amount. Opening up multiple trading accounts is also a good idea so that traders can compare spreads and costs, liquidity and price movements.
Generally speaking, withdrawing money regularly is a good practice so you actually notice the benefits of your hard work when trading. Leaving all the money accumulated can sometimes tempt traders to risk more and more and sometimes, the profits might disappear. Locking in profits is good from a psychological point of view.
Elliott Wave Risk Plan
Elliott Wave traders like to vary their risk depending on the Elliott Wave structure of a chart. Although we prefer taking fixed risk per setup, in certain circumstances it is possible to use slightly different levels of risk at certain moments. The risk should always vary slightly and never exceed the max risk of 5% of course.
The logic behind using more or less risk when trading the Elliott Waves is that some waves are more interesting to trade than others. A wave 3 for instance has more potential than a wave 4 because the 3rd wave offers space and momentum in one direction whereas a wave 4 is choppy and corrective.
How a trader divides the risk per wave is an open debate but here is a suggestion:
- Wave 1: 60% of usual risk
- Wave 3: 100% of usual risk
- Wave 5: 80% of usual risk
- Wave A: 40% of usual risk
- Wave C: 60%-80% of usual risk
Risk Management Ratios
A trader has a wide range of risk management ratios which they can use and analyse to assess their risk. All of this is explained in our course called SWAT – simple wave analysis and trading.
Reward to Risk (R:R) ratio
Traders are usually well aware of the importance of win vs loss percentage but not many traders realise that it is not only about how often a trade closes for a win. An equally important ratio is the R:R ratio, which indicates how much a trader wins when they win and how much they loss when they lose.
Traders love to focus on a high win record but they fail to see the dangers ahead. Even if you have 100 wins a row, one loss could wipe out all your gains. For instance, let’s say you win 1 pip in those 100 trades. You just won 100 pips. One loss of 150 pips however wipes out your gains and places you at a loss, assuming equal risk on all setups. Being “right” like this could lure traders into a false sense of safety.
Traders must realise that profitable trading is about the win rate and the r:r ratio. Here is how you can calculate the expected profitability:
Expected profitability = (win rate * average win) – (loss rate * average loss)
If the win rate multiplied by the average win is higher than the loss rate multiplied by the average loss.
For instance, a system with 67% win rate, average win of 0.91, and average loss 0.73.
(0.67 * 0.91) – (0.33 – 0.73) = (0.6097) – (0.2409) = +0.3688 positive expectancy per each setup.
This means that with 1% risk per setup and an average of 13 setups a week, traders can expect to earn 4.7944% a week, or about 20% a month.
These statistics are not random. They are in fact the results that our ecs.LIVE service has managed to achieve between 23 October 2017 and 12 April 2019. If you want to benefit from the same trading setups, including our own entries, stop losses, and take profits pre-fact, plus education, live webinars, and live analysis, then join our ecs.LIVE service now.
Sharpe ratio
The sharpe ratio is an interesting statistic that helps explain whether your return is sufficient in relationship to the risk of your strategy (or portfolio). The Sharpe ratio was developed by Nobel laureate William F. Sharpe. The ratio is the average return earned in excess of the risk-free rate.
It is calculated as follows:
Sharpe ratio: (expected portfolio return – risk free rate) / portfolio standard deviation
The standard deviation is a statistic that measures the distribution of performance compared to its average. It is calculated by taking the square root of the variance, which is the distance between result and average. If the data points are further from the mean, there is a higher deviation within the data set; thus, the more spread out the data, the higher the standard deviation.
The disadvantage of the Sharpe ratio for trading is that getting large wins is not a bad thing, yet for the sharpe ratio it would actually increase the standard deviation and make the strategy more risky. This is what the Sortino ratio has solved.
Sortino ratio
The sortino ratio is calculated as follows:
(expected return – risk free rate of return) / stand. deviation negative assets
The sortino ratio only looks at the volatility of losing trade setups. Large winners do not count towards a higher volatility, which therefore makes it a better measurement of reward to risk then the Sharpe ratio, especially in trading and Forex trading.
T-Statistic
The t-statistic helps calculate whether a trader is achieving their results from luck and randomness OR whether a sustainable approach is behind the success (source: Blue Owl Press).
This is VERY important as it provides a key understanding whether:
- The trading system is expected to be profitable in the long run.
- Traders are handling their risk management properly.
- Traders are progressing or in other words are we using less luck and more skills when achieving success.
The t-statistic basically indicates how much distribution you could expect around your average result (source: Blue Owl Press).
- When the variance is wide then there is high(er) chance that the result was pure luck (image below).
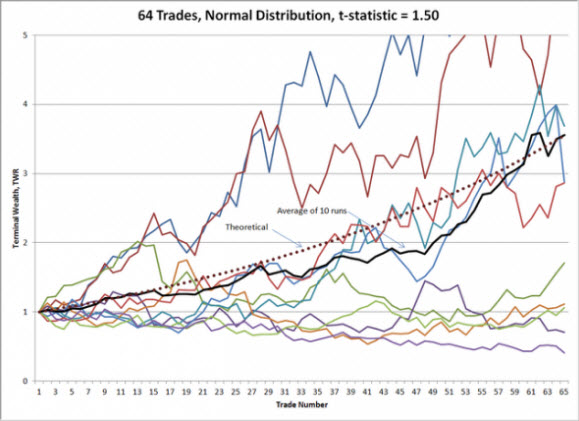
- However, if the variance is small then there is a higher chance that traders will see a similar repeat of previous results in the future (image below).
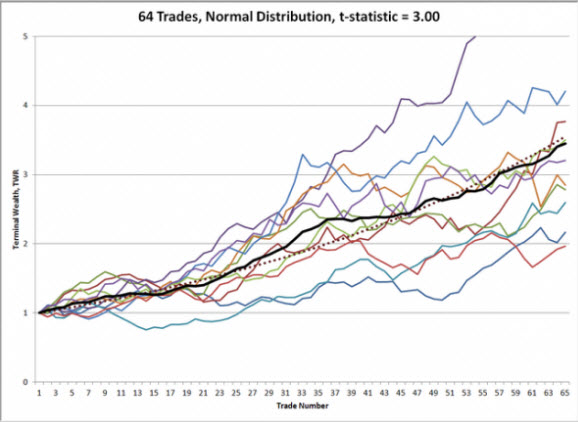
- A higher t-statistic indicates low levels of variance and hence increases the level of confidence.
-
- The lower variance and higher t-statistic is better for you as a trader and is a critical aspect of a trader’s consistency.
- A t-statistic above 2.0 is considered long-term viable / sustainable.
- The higher the t-stat figure, the better it is for a trader. A t-stat of 4 is better than 3 and indicates less variance.
- A lower t-statistic indicates high levels of variance and thus decreases the level of confidence.
- A t-statistic below 1.0-1.5 is bad and a t-statistic of 1.5-2.0 still needs to prove itself.
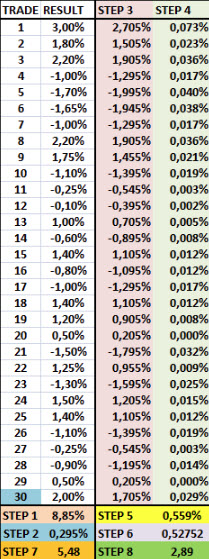
Here are the step by step instructions to calculate the t-statistic yourself:
Step 1) Choose a group of weeks, months or a bunch of trades you want to analyze. It’s good to have a sample size of minimum 30 trades. Take the % result of each setup and then count the total of all the setups.
Step 2) Divide the total by the number of trades to get the average result per trade.
Step 3) Take the % result of each setup and subtract the average (point 2) per trade.
Step 4) Multiply the result of point 3 of each row by/times point 3.
Step 5) Count the total of point 4 for all rows.
Step 6) Divide the average result per trade (point 1) by point 5.
Step 7) Square root of the number of trades.
Step 8) Multiply point 7 by point 6 = t-statistic.
For more information, free analysis, webinars, videos, tools, systems, and methods for trading stocks, cryptos, Forex and options, please check out my website www.EliteCurrenSea.com.
Wish you good trading,
Chris Svorcik


Excellent presentation, Chris.
The idea of adjusting lot sizes to control risk level is new to me, as only standard lots and no decimal lots are traded in the FX market due to the highly rigid regulation here.
Thank you!!