Letting Your Winning Trades Run with Fibonacci Sequences (ecs.WIZZ)
Dear Traders,
How do you know when the price will move impulsively or correctively? And more importantly, when can traders know when they can aim for a larger win?
Most traders do not have an answer. They get scared by both impulsive and corrective price movements. They might close their winning setups too soon because an impulse just started… Or they might close their trade too late after the correction already has occurred.
The ecs.WIZZ indicator, which is based on Fibonacci sequence levels, solves this for us. Here are some of the advantages for traders (more in the next part):
- Identify when the price is likely to behave correctively or impulsively.
- Understand when the market is in range vs trend territory.
- Locate key targets.
- Understand where to expect larger price movements and wins.
Use ecs.WIZZ for Finding the Space
The benefits of the Wizz concept and tool are of immense value to our trading because of these following reasons:
- It warns us when the market is ranging and corrective.
- It explains to us when the market is trending.
- We know when to exit for small or average wins when price is in a corrective phase.
- We let winners run when the price is in an impulsive phase.
- We are warned when trends become overstretched.
- We can aim for better targets and stop losses.
- You can also use it your own system as a filter, to avoid bad levels for entries.
- All in all, it allows traders to let winners run and cut losses short.
All of these Wizz benefits are key concepts in trading but very few explain how to implement this on real charts. Especially letting the winners run and cutting losses short is often cited as the main goal for traders but most educators fail to explain how this can be done from a practical point of view. They only loosely refer to the concept without going into specifics and practical examples how traders can actually follow the advice.
The ecs.WIZZ indicator is a powerful concept and tool for letting winners run but also knowing when to expect choppiness and corrective price action.
Pretty impressive right?
Before we dive into how Wizz manages to do all that, let me explain that the ecs.WIZZ concept and tool was created by me, Chris Svorcik, and developed and improved by both Mislav Nikolic and myself. Mislav has helped to substantially improve and automate the tool.
What is ecs.WIZZ?
The ecs.WIZZ concept is based on how far price can reach certain Fibonacci sequence levels without returning back to the 144 ema close.
So simply said, the ecs.WIZZ tool is based on the Fibonacci sequence levels plotted on the charts in pip value.
Most traders use Fibonacci levels, ratios, extensions, and targets to some degree. The Wizz tool, however, uses the sequence levels themselves for counting price movement, rather than the ratios.
The ecs.WIZZ indicator is focused on currency pairs and MT4 because the Fibonacci sequence levels are measured in pips – but the principle can be applied to any chart and time frame.
Here is a simplified version of how the idea works:
- The Fibonacci sequence levels (called Wizz levels) are plotted with the trend direction away from the 144 ema (with the 144 ema as the starting point).
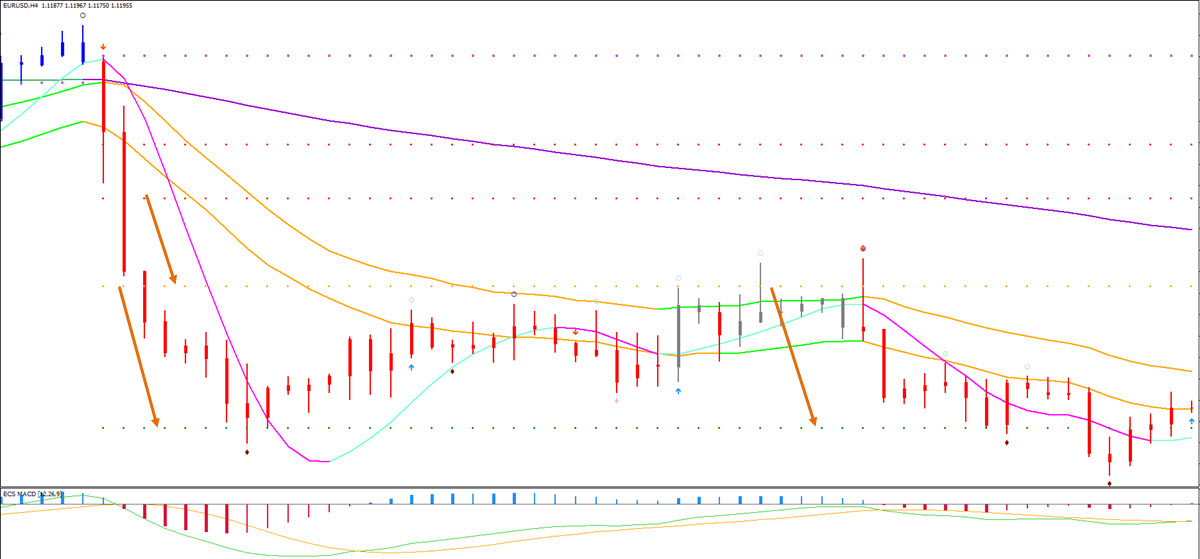
- Price is close to the 144 ema: high chance of corrective price action.
- Price has traveled some distance from the 144 ema: high chance of impulsive price.
- Price has moved far from the 144 ema: high chance of corrective price action.
Whether price is considered to be close, some distance, or far from the 144 ema fully depends on the Fibonacci sequence levels.
It is a simple concept that all traders can do manually without any external help… BUT it takes time to calculate… And it is more vulnerable to errors.
Our ecs.WIZZ indicator does help automate the entire process because it automatically plots the levels from the valid and current 144 ema close.
Speed vs gravity with ecs.WIZZ
Before we explain the exact details of the ecs.WIZZ idea and what the indicator does, we need to explain the logic of the idea.
The theory behind the concept itself is simple:
- Once price is able to substantially move away from the average, then the price is more likely to continue to move away from the averages with more momentum.
- The closer that price and the 21 ema zone are to the 144 ema, then the more difficult it is for price to move away from the 144 ema, which turns into gravity.
You can compare the price to a tennis ball for instance. The more speed the ball has, the further up it can go up before gravity eventually pulls the ball back down to earth. If the ball has a low speed, then gravity will kick in quicker.
Price is the same as a tennis ball. Speed is equal to momentum and gravity is the same as the 144 MA. But how do you measure whether price has enough momentum to pull away from gravity (the 144 ema close)?
This is the key question. And the answer is based on Fibonacci sequence levels and how far the price can move away from the 144 ema.
The Fib sequence counting from the 144 ema is a concept that we call ecs.WIZZ.

ecs.WIZZ levels with different time frames
Now let’s dive into the details… First of all, which Fibonacci sequence (WIZZ) levels are used?
This depends on the time frame but these numbers are used for anything below the daily chart:
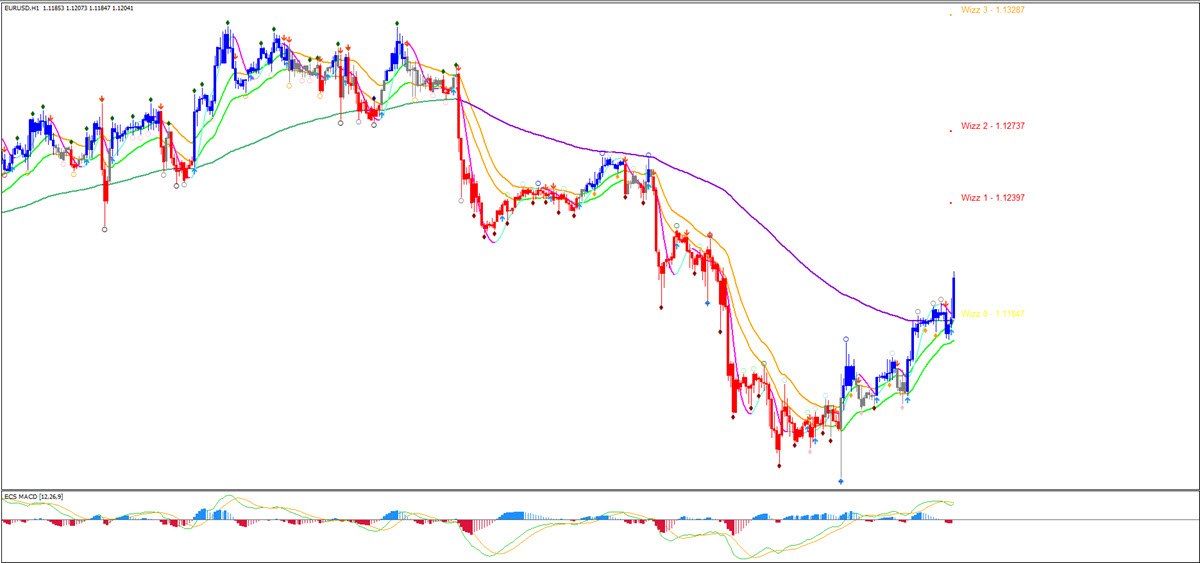
- Wizz 0 = the base of the Wizz and is roughly equal to the 144 ema close.
- Wizz 1 = most recent top or bottom is 13 pips away from 144 ema.
- Wizz 2 = most recent top or bottom is 21 pips away from 144 ema.
- Wizz 3 = most recent top or bottom is 34 pips away from 144 ema.
- Wizz 4 = most recent top or bottom is 55 pips away from 144 ema.
- Wizz 5 = most recent top or bottom is 89 pips away from 144 ema.
- Wizz 6 = most recent top or bottom is 144 pips away from 144 ema.
- Wizz 7 = most recent top or bottom is 233 pips away from 144 ema.
- Wizz 8 = most recent top or bottom is 377 pips away from 144 ema.
- Wizz 9 = most recent top or bottom is 610 pips away from 144 ema.
The below numbers are used if price breaks away from Wizz level 9 (above Wizz 9 in uptrend and below Wizz 9 in downtrend) when looking at time frames below the daily chart:
- Wizz 0 = the base of the Wizz and is roughly equal to the 144 ema close.
- Wizz 1 = most recent top or bottom is 55 pips away from 144 ema.
- Wizz 2 = most recent top or bottom is 89 pips away from 144 ema.
- Wizz 3 = most recent top or bottom is 144 pips away from 144 ema.
- Wizz 4 = most recent top or bottom is 233 pips away from 144 ema.
- Wizz 5 = most recent top or bottom is 377 pips away from 144 ema.
- Wizz 6 = most recent top or bottom is 610 pips away from 144 ema.
- Wizz 7 = most recent top or bottom is 987 pips away from 144 ema.
- Wizz 8 = most recent top or bottom is 1597 pips away from 144 ema.
- Wizz 9 = most recent top or bottom is 2584 pips away from 144 ema.
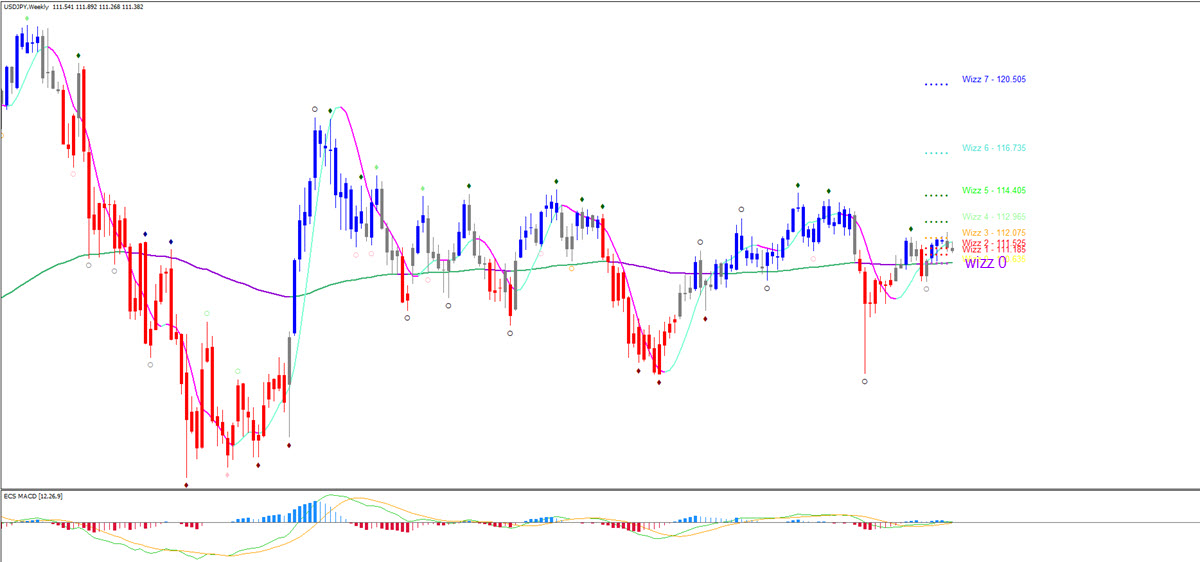
Here is an overview of the levels and how they vary per time frame:
| Wizz / time frames | Below daily | Below daily (extended) |
Daily | Weekly |
| Wizz 1 | 13 pips | 55 pips | 89 pips | 144 pips |
| Wizz 2 | 21 pips | 89 pips | 144 pips | 233 pips |
| Wizz 3 | 34 pips | 144 pips | 233 pips | 377 pips |
| Wizz 4 | 55 pips | 233 pips | 370 pips | 610 pips |
| Wizz 5 | 89 pips | 370 pips | 610 pips | 987 pips |
| Wizz 6 | 144 pips | 610 pips | 987 pips | 1597 pips |
| Wizz 7 | 233 pips | 987 pips | 1597 pips | 2584 pips |
| Wizz 8 | 377 pips | 1597 pips | 2584 pips | 4181 pips |
| Wizz 9 | 610 pips | 2584 pips | 4181 pips | 6765 pips |
Why are the levels different for lower and higher time frames?
Because a smaller price movement has more effect on a 15 minute chart. Price needs to move less distance on a 15 minute chart before it hits a critical level because price action is relative. A 34 pip move on a 15 minute chart is a decent price movement but not for a 4 hour chart.
The same principle is valid for the 4 hour and daily charts. A 144 pip movement is critical for the H1 chart but not for the daily. For higher time frames, price needs to move 233 pips (daily) and 377 pips (weekly) before there is sufficient speed to escape gravity (the 144 ema).
The more price moves away from the 144 ema, the more likely it will be able to hit larger Fibonacci sequence levels (Wizz).
What do the WIZZ levels mean?
Now the main question is: how can you interpret those Wizz levels?
- Corrective phase: Wizz 0-2. Price is expected to move correctively if price is in between Wizz level 0 and 2 (anything between 0 and 21 pips).
- Range or breakout, which depends on impulse: Wizz 2-3. Price is in a grey zone (corrective or impulsive) in between Wizz level 2 and 3 (anything between 21 and 34 pips).
- Impulsive phase: Wizz 3-6/7. Price is expected to move impulsively once price moves beyond Wizz level 3 and 6-7 (between 34 and 144/233 pips):
- Trendinging but corrective (depends on the pair): Wizz 6/7-8. Price is expected to move with the trend but slower once price moves beyond Wizz level 6/7 and 8 (between 144/233 and 377 pips).
- Corrective phase and reversal potential and price is in reversal territory to move back to 144 ema: Wizz 8-9. Price is expected to move with the trend but correctively once price moves between Wizz level 8 and 9 (between 377 and 610 pips):.
- Super strong trend and cycle: break of Wizz 9. A break beyond Wizz level 9 indicates the need to reset the Wizz levels. In that case, the new Wizz level 1 starts at 55 pips (not 13 pips) and old Wizz level 9 becomes new Wizz level 6. The rest of the Wizz logic remains the same, but not with more spacious Wizz levels until price hits the 144 ema again (reset of Wizz levels).
Most important is that when price is able to break above Wizz level 3, then usually price has enough speed to move away from the 144 MA (gravity).
If it stays within Wizz level 3, then the speed is usually low and price often retraces back to the 144 ema (due to the gravitational forces that pull the price back to the mean or average).
Summarized:
- Wizz 0-2 → Range
- Wizz 2-3 → Range – Breakout Zone
- Wizz 3-6/7 → Impulsive Zone
- Wizz 6/7-8 → Trend But Can be Slower
- Wizz 8-9 → Corrective and Reversal Warning
- Wizz 9+ → Potential Super Strong Trend
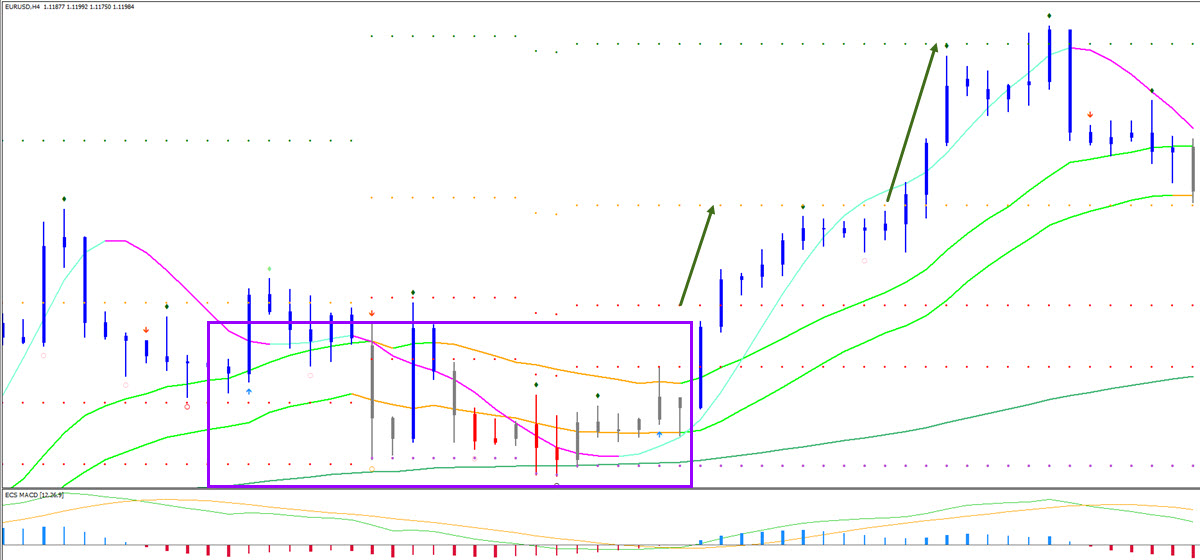
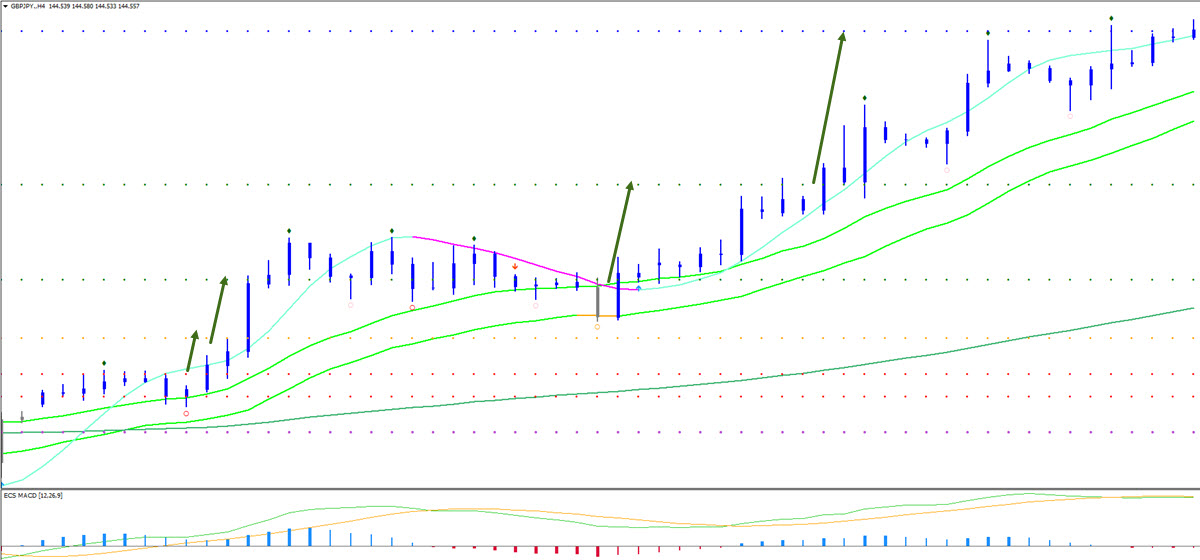
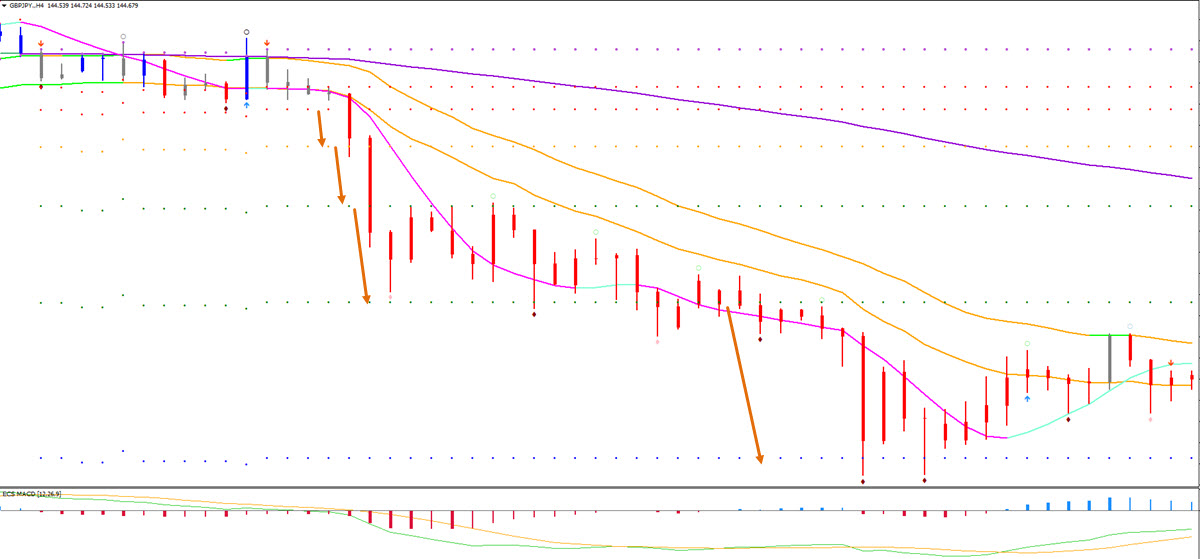
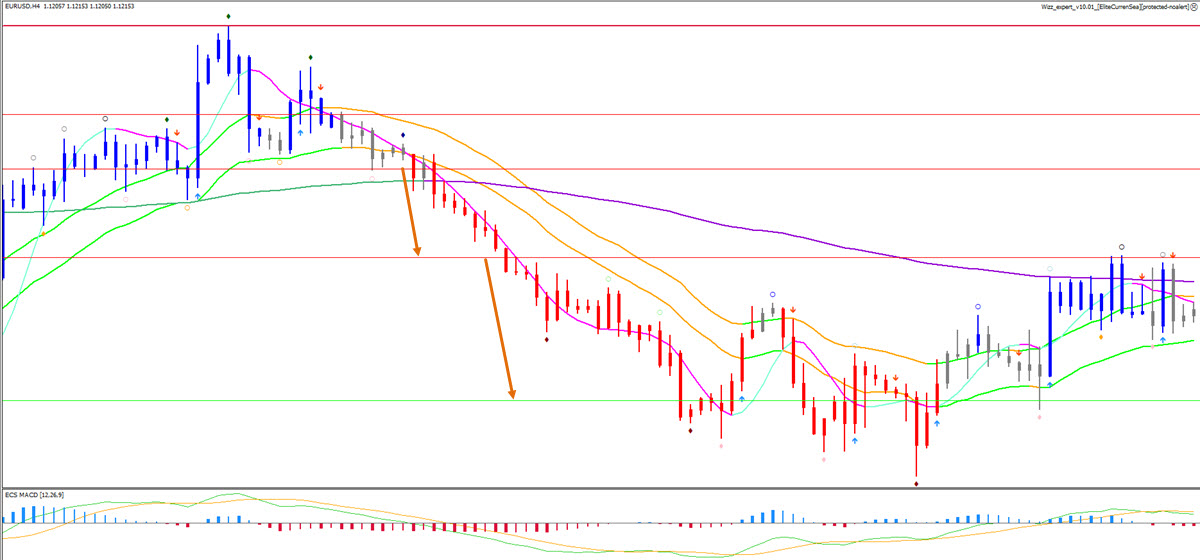
How to find the wide open chart spaces
So where is the wide open space on the chart? Where could you expect the price to move fast and quickly to the target(s)?
The key zone (for 1 hour charts) is between Wizz level 3 and 6-8. This is where traders can expect quick price action, which is why we call it “wide open space”.
When the price is in this area, It is beneficial to keep the trade open and aim for higher targets or use a loose trail stop loss on average. Why? Simply because there is a high chance that the price will move far and quickly.
Then again, we are more careful in other price areas or phases here we will aim for closer targets because the price is either in a corrective mode or is overstretching itself within the trend. We can’t overemphasize the importance of this information for our trading decisions.
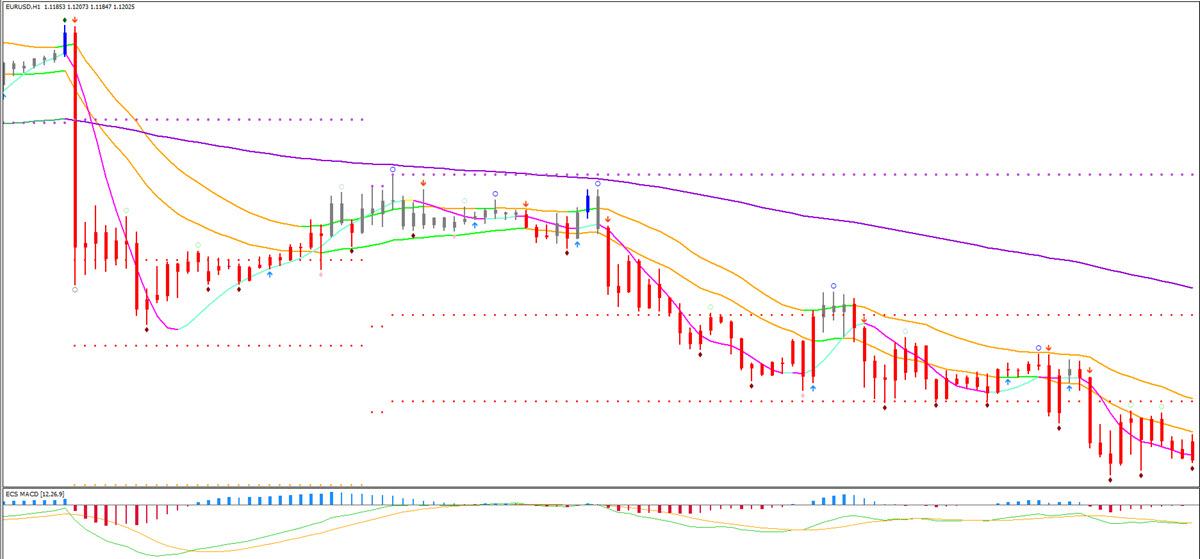
ecs.WIZZ levels with different pairs
The standard levels are valid for pairs such as the EUR/USD, USD/JPY and AUD/USD, but for fast (volatile) moving pairs, the levels need to be adjusted.
Volatile currency pairs include the GBP/JPY, GBP/AUD, GBP/NZD, and GBP/USD. We recommend using the same Fibonacci sequence levels for these pairs but keep in mind that the pairs are able to push to higher Wizz levels on average.

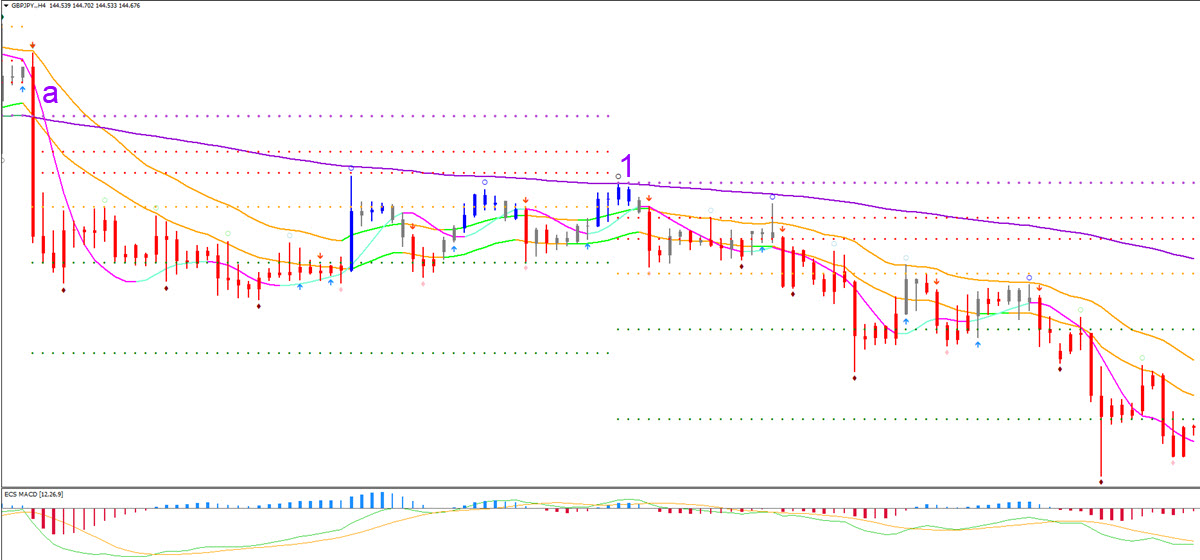
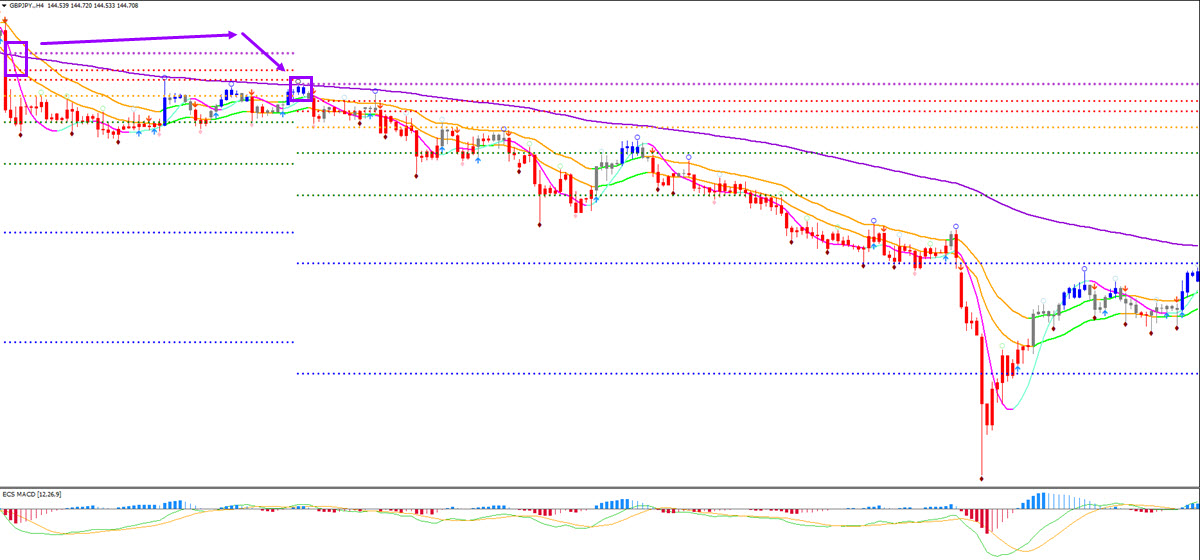
Where to place ecs.WIZZ indicator exactly
This is how you can calculate which Wizz level price has been reached.
- Find the spot where price hit the 144 ema close (or come very close to hitting it – see the next sub paragraph on when to reset the Wizz indicator).
- Then calculate how many pips the recent top or bottom has moved away from 144 ema (the spot where price last hit the 144 ema – see point 1)
- Either based on our ecs.WIZZ indicator or via your manual counting, understand which Wizz level price has reached.
The good news is that you can use our ecs.WIZZ indicator to do this automatically. The advantage of using the most current version of the ecs.WIZZ indicator is that traders only need to add the indicator to the MT4 chart and the Wizz levels will be added automatically.
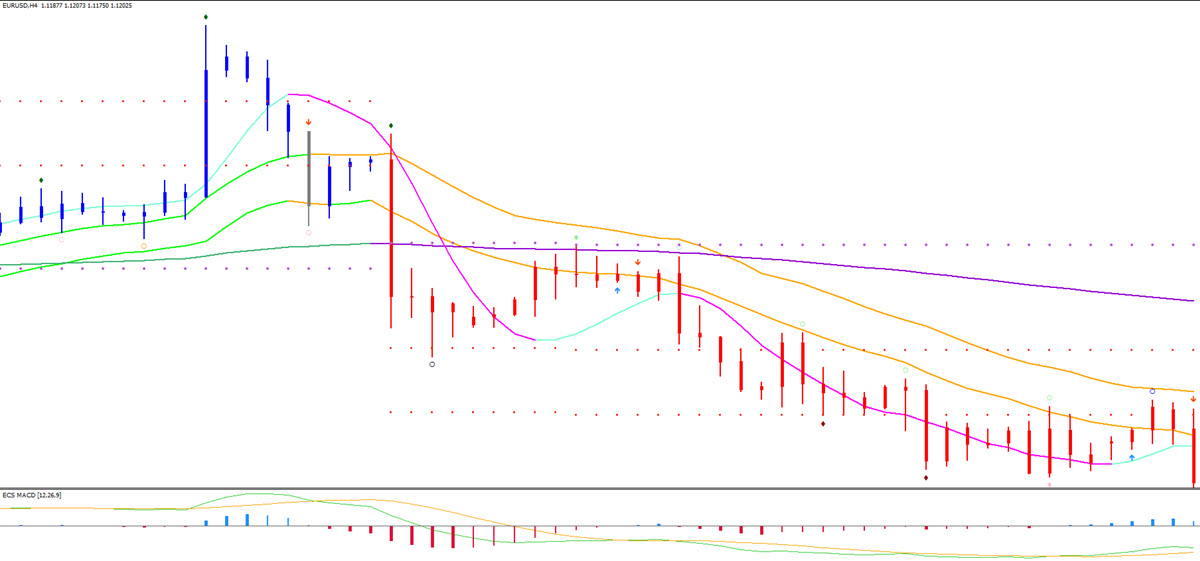
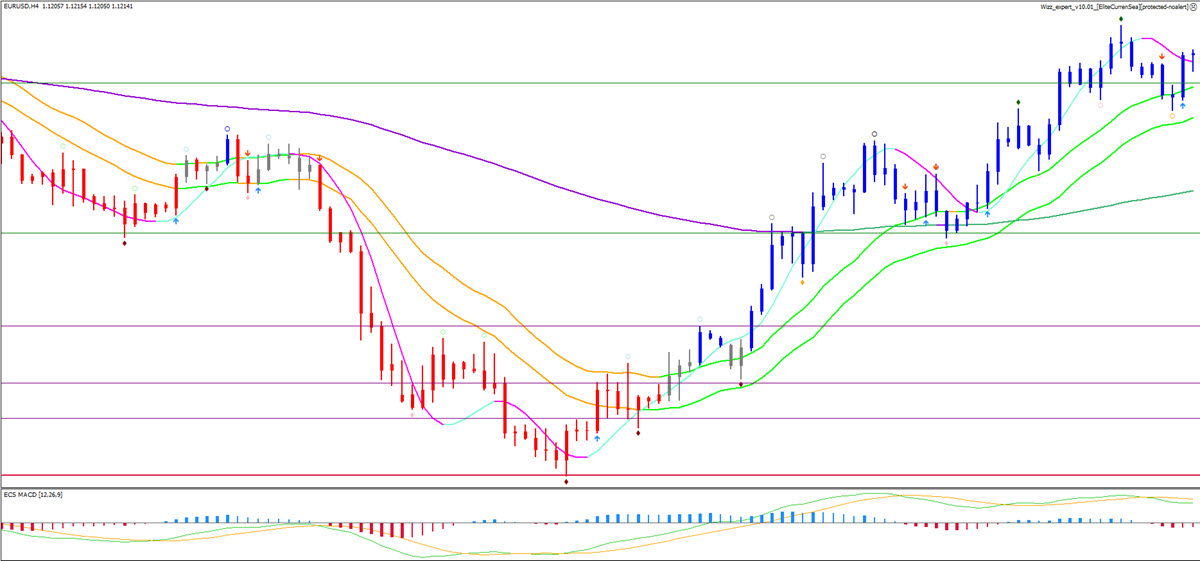
No manual work at all and the ecs.WIZZ indicator does all the work error free as well. Once the Wizz indicator is attached to the MT4 charts, it shows the Fibonacci sequence levels that are plotted from the 144 MA:
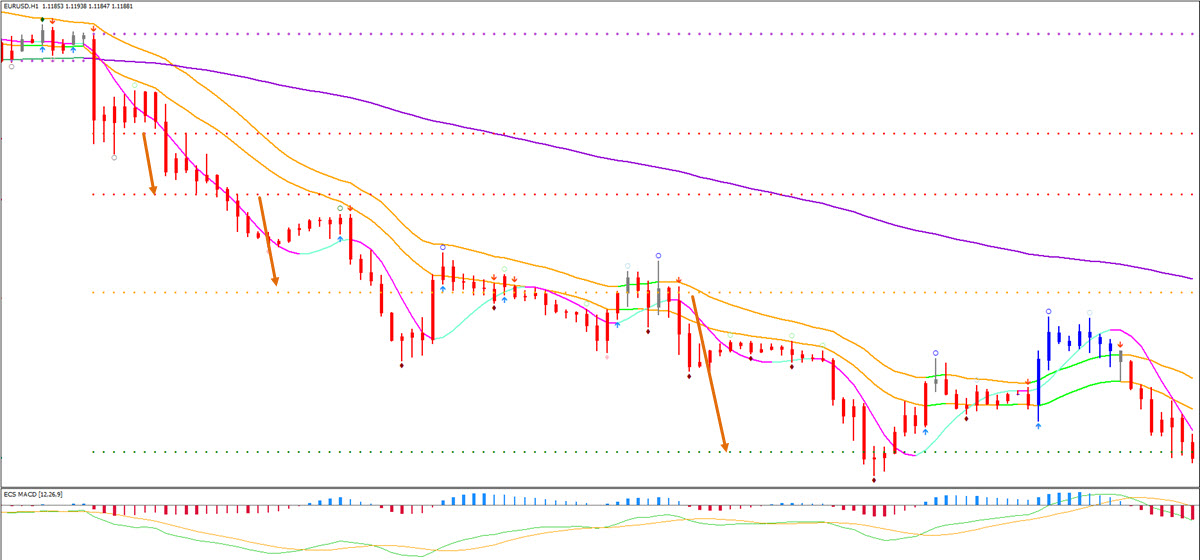
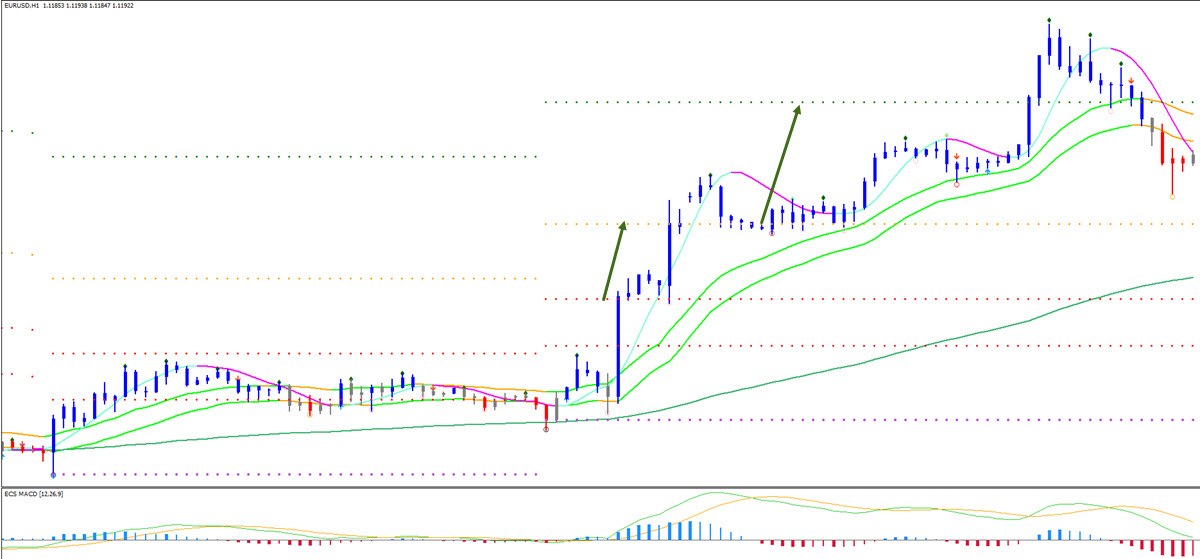
- Wizz levels appear above 144 ema in uptrend.
- Wizz levels appear below 144 ema in downtrend.
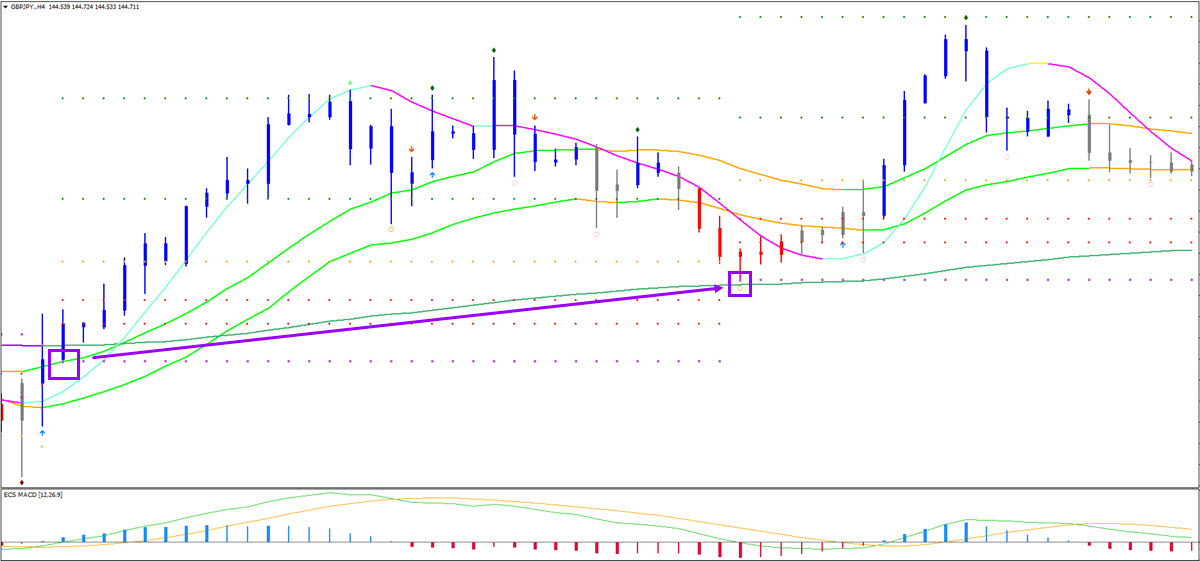
If you are using the concept on other platforms (besides MT4) or if you are using an older version of ecs.WIZZ, there are a couple of points that you can use for starting with the Wizz levels of placing the Wizz indicator:
- The Fractal closest to the most recent hit of the 144 ema.
- The candle high (downtrend) or candle low (uptrend) closest to the most recent hit of the 144 ema.
- The 144 ema value itself.
Mislav Nikolic likes to use more precise rules for placing the Wizz tool around the 144 ema:
- The candle high or low is closest to the most recent hit of the 144 ema.
- There are a couple of exceptions to the main rule:
- When a larger candle (over 90 pips) crosses over 144 ema → Wizz base is placed at the 144 ema itself, rather than at the base of the candle.
- When a candle of between 80-90 pips crosses over 144 ema and the body of candle (open – close) is at least 60 pips → use 144 ema and not high/low of candle.
- When a full or almost full body candle (with no wick or minimal wick) crosses over the 144 ema close and the candle is more than 70 pips in total (measured from high to low) → use 144 ema and not high/low of candle.
- If next candle after crosses over 144 ema close is less than 2 pips from ema → use that next candle rather then the candle that crosses 144 ema.
When to reset the ecs.WIZZ indicator
The standard idea behind ecs.WIZZ is to use the 144 ema close.
Generally speaking the Wizz base and starting point is only moved or changed when price hits the 144 ema close. In other words, each time candle hits that ema 144 close, base of wizz is restarted.
But Mislav Nikolic made an improvement after he noticed that there should be an exception once price gets close to the 144 ema after a certain period of time.
- If candle approaches 144 ema close within 10 pips or closer AND after not hitting 144 ema close for 20 candles or more, this is also a new wizz base (even though price failed to actually make a full hit at the 144 ema close) .
- When the market creates a price gap which goes over or below the 144 ema, then we use the base of the new candle after the creation of the gap. For example when a price gap closes above the 144 ema close and there is no candle that actually broke through the 144 ema, then we use the low of the candle which created the gap.
Using ecs.WIZZ indicator as targets
The value of using Wizz is for understanding where traders can find the open space on the chart and when they can expect impulsive and corrective price action. But ecs.WIZZ levels can also simply be used as targets. Keep in mind that they are best used in confluence with other tools and indicators rather than as a stand alone concept.
Here is how traders can use the Wizz levels:
- Below Wizz 3 → Aim for next Wizz level or Wizz 3
- Between Wizz 2 & 3 → Aim for Wizz 3 or breakout at Wizz 4
- Break of Wizz 3 level → Aim for Wizz 4 or Wizz 5
- Break of Wizz 4 level → Aim for Wizz 5 or Wizz 6
- Break of Wizz 5 level → Aim for Wizz 6 or Wizz 7
- Break of Wizz 6 level → Aim for Wizz 7
- Break of Wizz 7 level → Aim for Wizz 8
- Break of Wizz 8 level → Aim for Wizz 9
When to use tops/bottoms or 144 ema close
The standard idea behind ecs.WIZZ is to use the 144 ema close but traders can also use the top or bottoms for additional targets. They need to use an older version of ecs.WIZZ where traders need to click on the spot where they want the Wizz tool to start.
- In a downtrend, traders can add the Wizz tool to the top.
- In an uptrend, traders can add the Wizz tool to the bottom.
Traders could also use the tops or bottoms for reversal or retracement targets:
- In a downtrend, traders can add the Wizz tool to the bottom for reversal levels.
- In an uptrend, traders can add the Wizz tool to the top for reversal levels.
ecs.WIZZ indicator explained
Although traders can efficiently use this concept without any tool or external help, the ecs.WIZZ indicator and Wizz Expert Advisor help reduce any errors by simplifying the process. They make it a lot easier to immediately see all the correct levels and it’s much faster to remove and add a new set of levels.
As mentioned before, the ecs.WIZZ indicator automatically plots the levels based on the 144 ema close. The ecs.WIZZ EA is manually placed on the desired spot of the chart together with the desired direction (up or down). The advantage of having two Wizz tools is that it can be useful for pinpointing extra confluence.
To summarize: our analysis of the market structure is incomplete without using Wizz because it immediately informs us of so much information such as
- Is the market trending?
- Will it be impulsive or correction?
- Is the trend overstretched?
- What are realistic targets?
- Should I aim for a small or large profit?
- Should I use a trail stop loss to catch a bigger win?
Most people advertise their system when it works best. A trending system will work well in a trend but how will it handle a range? Usually real trouble occurs when a trending system faces a corrective market. Wizz shows how to detect and avoid this.
For more information, free analysis, webinars, videos, tools, systems, and methods for trading stocks, cryptos, Forex and options, please check out our website www.EliteCurrenSea.com.
Wish you good trading,
Chris Svorcik


Leave a Reply