How To Use Price Action Flows From The Chart

Dear Traders,
Correctly analysing price action flow is a key part of understanding the path of the least resistance. By knowing whether the price swing is behaving impulsively or correctively, traders can create a strong edge when reading the charts.
This article explains the role of price action in the path of least resistance, shows the four types of price action, explains impulsive and corrective price action, and introduces the concept of energy versus gravity.
Price Action Flow in Path of Least Resistance
The flow of price action is key for analysing the path of least resistance. Equally important is the concept of resistance. Here is how it works: the strength of the resistance versus the strength of the price flow will determine the path of least resistance for price on any Forex or financial chart.
Simply said, both resistance and flow are in a constant battle and the outcome impacts the price path as follows:
- Stronger price flow will beat weaker support or resistance.
- Weaker price flow will lose versus stronger support or resistance.
Our “path of least resistance” articles examines this concept in fine detail. Today’s article, however, focuses on how to actually measure the flow of price action.
The resistance part has already been reviewed in detail via our Ultimate Guide on Support and Resistance (S&R). It provides a deep overview of how to determine S&R, what tools and indicators to use, how to use S&R and much more. Now it’s time to analyse the flow of price action.
The 4 Types of Price Action
It is important to know that strong price movement is called impulse or momentum whereas weak price action is known as corrective or consolidation. The strength or weakness of price flow can be understood by analysing whether price is behaving impulsively or correctively.
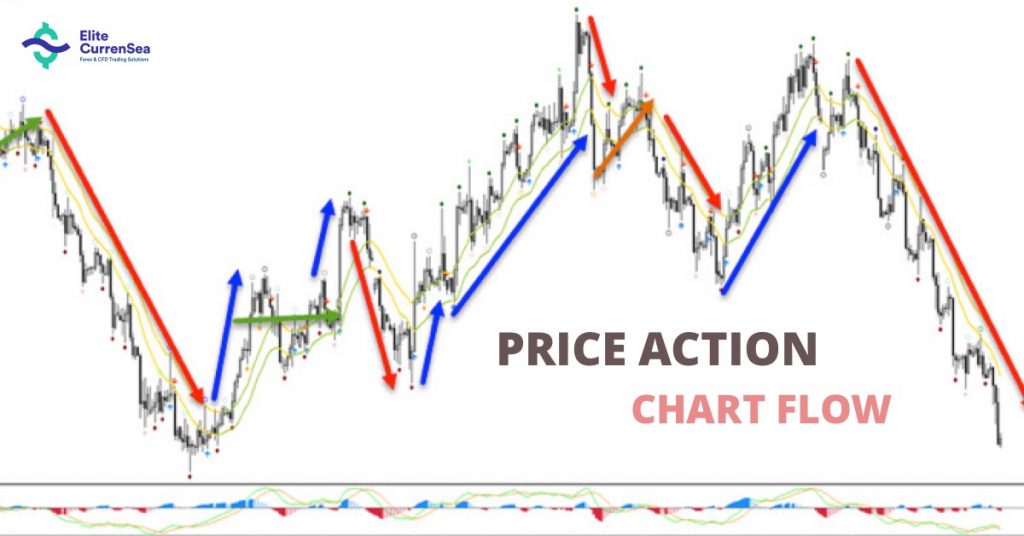
Both strong and weak price action can take place during bullish and bearish price movements, which is why they are sometimes divided into bullish and bearish price action movements. Simply said, impulse and corrections forex can be either bullish (price is moving up) or bearish (price is moving down). This creates four different types of price movements, which in some ways can been seen as “DNA” or heart beat of the market:
- Bullish impulse
- Bullish correction
- Bearish impulse
- Bearish correction
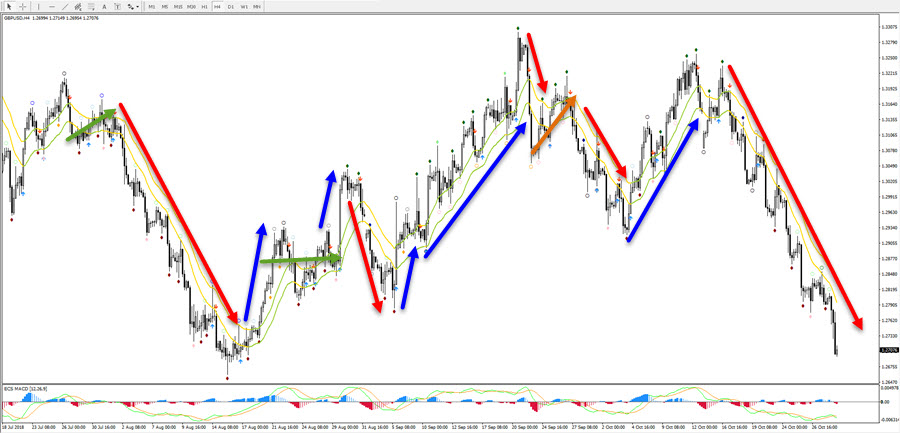
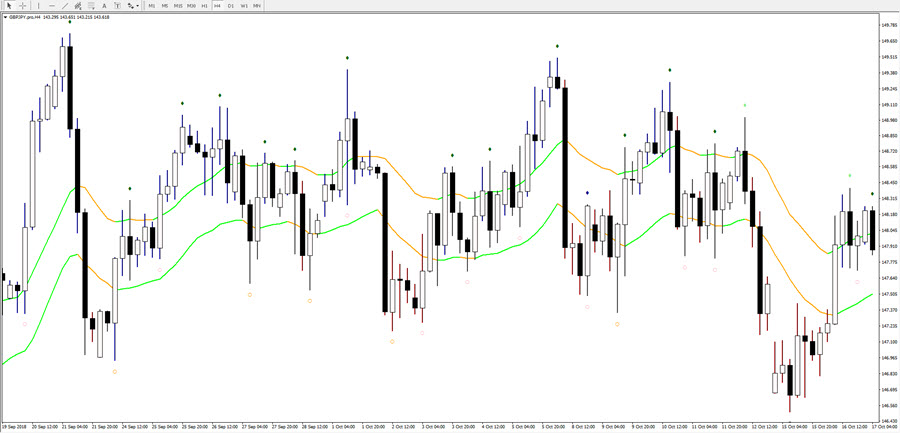
GBP/USD 4 hour chart: blue arrows indicate bullish momentum, green arrows indicate bullish correction, red arrows indicate bearish impulse, and orange arrow indicates bearish correction.
Each of these four variations represents a separate “price swing”, which is considered to be a group of candlesticks where the majority share common direction (bearish or bullish) and strength (strong or weak). Basically, every price swing is either bearish or bullish and either impulsive or corrective. (Price movement is also called price action, a price swing, swing, or swing high and swing low.)
You might be wondering: what is the benefit of knowing this information about the price swing? Traders that correctly analyse and understand price swings have the following advantages:
- Analyse past price swings to estimate the current price action more accurately.
- Analyse the current price swing to understand how long it will last and when it could end.
- Analyse past price swings to estimate the character of the text swing price swing.
Based on above info, traders can make better decisions about their trades, such as skipping setups, managing open trades, and entering trade setups. Price swings are not the only factor for trading decisions, of course, but certainly play a key role in our own analysis.
Strong vs Weak Price Action
Let’s examine what traders should consider as “impulsive” (strong) or “corrective” (weak) price action. Here is an an overview:
- Impulsive: strong price action is quick and moving in one direction.
- Corrective: weak price action is moving indecisively, slow, and sideways.
Impulsive Price
Impulsive price action is characterised by a couple of main factors:
- Majority of candles
Most of the candlesticks in the group (price swing) have a close in the same direction (bullish or bearish). This can be measured as a rough estimate and does not have to very precise. Once +/- 65% or more of the candles in the group are either bullish or bearish, then the swing is more likely to be a bearish or bullish momentum.
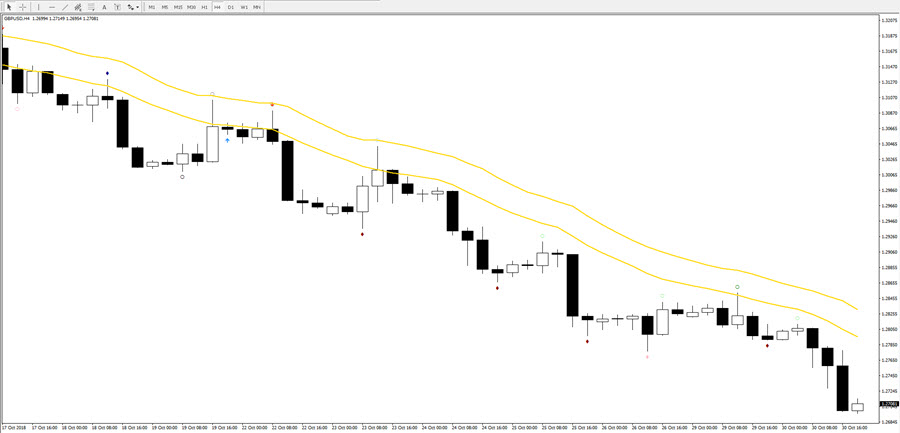
Most candles are bearish in this bearish momentum. Approximately 70% of the candles are bearish, not counting smaller candles that are “dojis” (open is near to candle close). Also many bearish candles have close near low. - Candle close near high or low
Many of the candlesticks show strength by closing near the high or low. Strong bullish candles close near the high whereas strong bearish candles close near the low. The close is important because it shows that the bulls or bears are in control of that time period.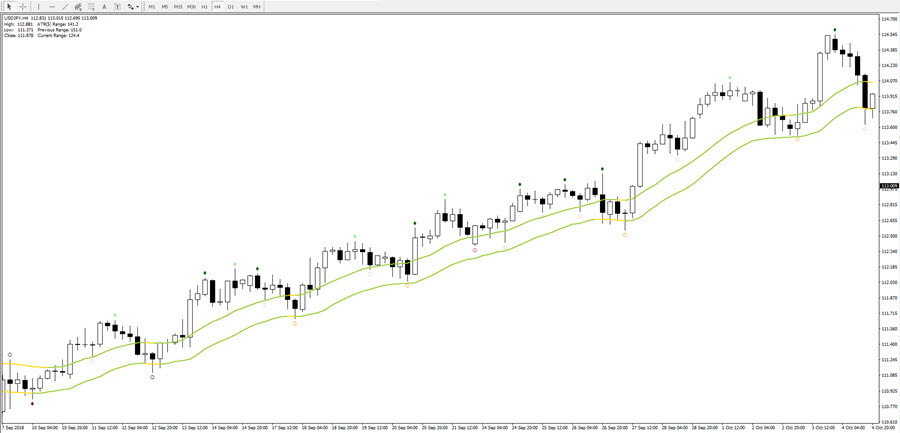
Bullish example where majority of candles are bullish candles. Most bullish candles have close near high. The larger candlesticks are bullish. Also a new high is regularly posted. All characteristics of an impulse. - A new higher high or lower low
The impulse is still strong if price has recently made a new higher high or lower low when compared to the previous candle(s). A new high however confirms the bullish impulse. The same is valid for bears and the importance of showing a new lower low. A price swing might lose its momentum if a candle fails to make a new high or low and could start a correction. - Large candlesticks
The impulsive candles are usually larger and more ‘dominant’. The size of the candle is measured by calculating the distance between the candle high and low. Impulsive price action often has a couple of candles in the price swing that are large and a few that are moderately large in comparison with the other corrective candles. There is no fixed rule of what is considered a large, medium or small candlestick. The best is to make a simple comparison on the time frame you are analysing with the most recent price action and check whether the candles are larger than the estimated average.
Corrective Price
Corrective price action is characterised by factors that are mostly the opposite of impulsive candles:
- Mixture of candles
There is no side (bullish or bearish) that has a clear majority. The candles are a mixture of bull and bear candles with no particular sequence. Price action is mostly going sideways or is max showing a light angle up or down. - Candle closes near the middle. The candle closes indicate indecision as well by not closing near the high or low. Of course, some of the candles might still close near the high or low but usually this occurs a lot less often then with impulsive price action.
Typical corrective price action where price is choppy, moving sideways, and no clear sequences. There are a few larger candles which represent mini pieces of impulse but overall, price is choppy.
- No sequence of highs or lows
Corrective price action is mostly price action that goes sideways. In the correction there might be parts where price makes smaller ups and downs but overall the price action looks choppy and indecisive. Part of the reason why price action looks corrective is simply because one side is unable to control the direction, which means that there is no sequence of higher highs (for an uptrend) or lower lows (for a downtrend). - Smaller candlesticks
Corrective price action usually does not have (many) large candles. There might be an occasional candle that is bigger but that is certainly more of exception than a rule. Most candlesticks are small, indecisive, and show no particular direction either up or down. A few candles will have be bullish or bearish but will still be relatively small when compared to impulsive candles.
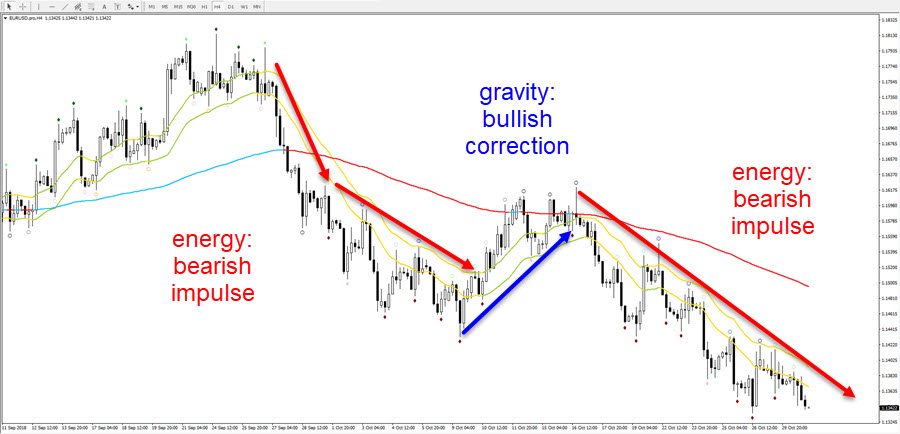
Energy vs Gravity
Impulse and correction are in a way the heartbeat of the market. Eventually impulsive price action will run out of steam, simply because nothing can move in one direction forever. The impulsive price action can however last for longer than you expect but the energy will eventually die down and candles will either become corrective and slow down in their movement or reverse into the opposite direction.
You can compare this to energy versus gravity. When you throw a ball into the air, it will keep pushing higher due to the momentum. Eventually, the ball will reach a peak in the air and slowly starts it decline towards the ground. Why? Momentum is not strong enough and the gravitational forces of the earth start to kick in. Momentum weakens and gravity starts to have an impact on the ball.
The same is true for price action:
- Price moves strongly in one direction for a while with impulsive price action.
- But then eventually the momentum weakens and price reverts into the opposite direction (back down or up).
At first momentum is stronger than gravity but eventually momentum weakness and gravity becomes stronger, thereby pulling price into a correction, which is either in the opposite direction (reversal) or sideways direction (consolidation).
Join our World of Trading by starting with ecs.SWAT or ecs.LIVE !
Good trading,
Chris Svorcik
Elite CurrenSea
P.S. Share our passion for trading and learn price action from our methods and techniques by:
- Joining our premium ecsLIVE channel.
- Subscribing to our ECS YouTube channel with:


Leave a Reply