? How Trade Daily Chart Reversals ?? Successfully
Subscribe
Dear Traders,
the idea of trading reversals seems to appeal to many of us. We are hoping to gain big profits if we can catch a new trend at the very start.
But doing this successfully is no simple task and one can easily get burnt more often than not.
This article will discuss the ins and out of trading reversals and offer suggestions on how to improve success probabilities.
The Problem with Reversals…
One of the main challenges of reversal trades is that we, as individual traders, are betting against the greater, established force… i.e. the existing trend. This dynamic can perhaps be better understood by the following analogy. Imagine the existing trend as a large heavy steam train in motion… chucking along a railroad. Then imagine the reversal trader as somebody, who is committing him/herself to standing at a spot somewhere along the railroad where he/she believes the train will come to a halt and go backwards… no doubt, we would have to be very sure about our analysis before committing ourselves to such a decision in order to come out unharmed.
We need to have multiple checks and factors come together to increase the chances that the trend is indeed coming to an end.
Following, therefore, are my main guidelines that should help with gauging reversal spots with more accuracy and trading them with a higher success rate:
1. Trend Scale
Even though trends appear on every time frame, there is of course a limitation of scale that has to be born in mind. What looks like a reversal on a lower time frame is usually merely a correction on a higher time frame.
Reversals pay the most dividend if they last for a prolonged period of time because one good entry can then yield increasing profits as the reversal deepens. They also provide great scale-in opportunities. I have therefore come to the realization for myself that reversal trades are really only worthwhile taking when they are based on at least a daily chart trend. The higher degree of uncertainty makes smaller time frames less appealing and limits profit potentials.
2. Momentum and Divergence
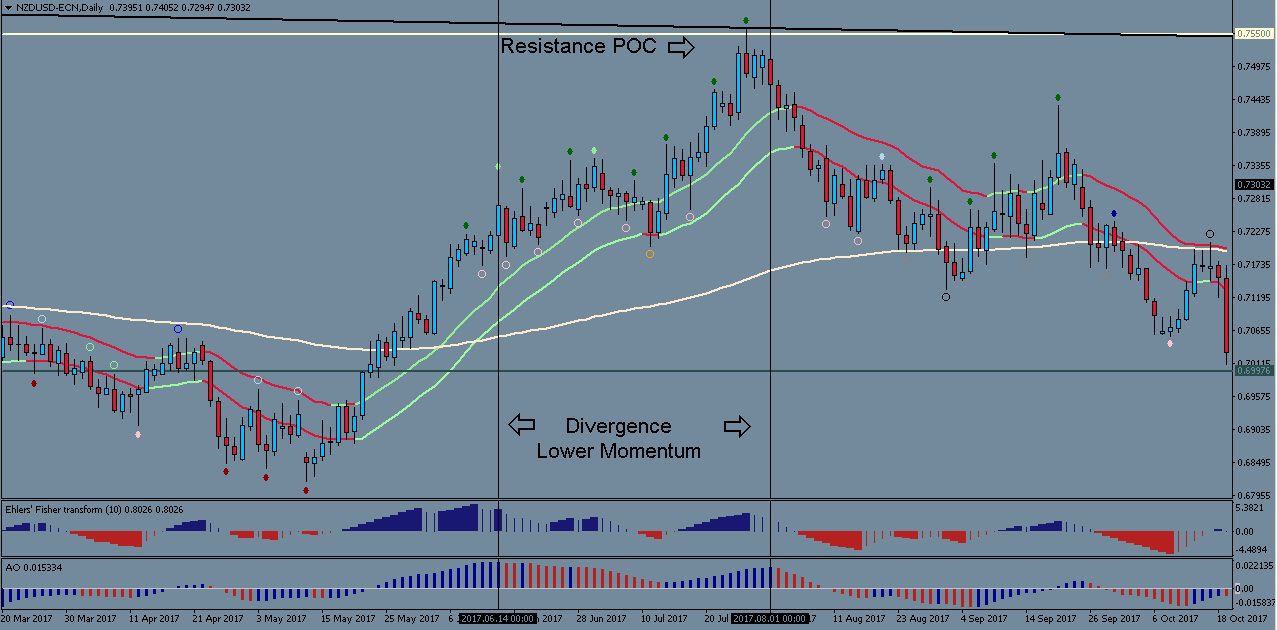
A good reversal setup must go hand in hand with decreasing momentum, i.e. the established trend has to show a reduction in strength. Many oscillator-type indicators can be used to detect decreasing momentum. One of my personal favorites is the Awesome Oscillator (AO).
For the purpose of trend reversals, I want to see divergence between price level and the AO on the daily chart. In addition, I want to see loss of momentum confirmed by the quality of the price-action. Price-action must start to become more choppy and horizontal. Dropping down to the 4-hour chart for this purpose can be useful.
3. Point of Confluence
Large trends don’t simply end in the middle of nowhere. They most often end at a price level that is a convergence of many support/resistance factors, i.e. a point of confluence (POC). Identifying these POCs is a critical step. For the purpose of reversal trading, a POC should consist of at least 3 or more strong factors, such as:
• A strong horizontal historical support/resistance level (check on daily and weekly charts)
• A prime Fibonacci level (i.e. 38.2%, 50%, 61.8%)
• A major trendline (Check daily, weekly and monthly charts)
• A long-term moving average (e.g. 100, 144, or 200) of a higher time frame chart
• A round price level with psychological significance (e.g. 1.20, 1.75, 1.00 etc)
4. Confirmation via Price-Action
The chances of trading a successful reversal increases greatly when price approaches one of these major POCs in conjunction with decreasing momentum. But the probabilities could even then still be too small for entering trades successfully at that point. Without some further confirmation from the market as a whole, we stand alone with our analysis, even if it is very sound and thorough. This is why price-action confirmation is so crucial for reversal trades.
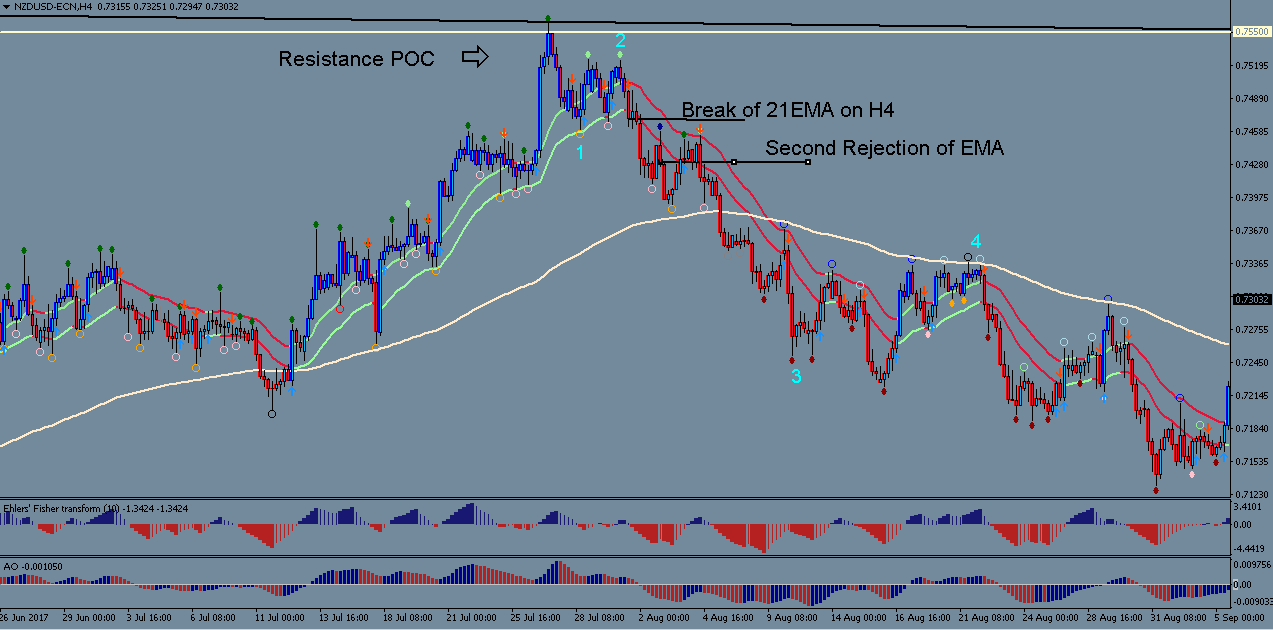
I have found the most success if I wait for the following price action confirmation before finally entering a trade:
• Price must break below the 21 EMA of the 4 hour chart, and confirm the break via a pullback towards it and another rejection from it.
It seems that the 21 EMA of the 4hour chart is an ideal gauge for whether or not enough market players are behind the reversal, and it provides very good early entry signals, which create beneficial reward-to-risk ratios. But remember that this 4-hour EMA break has to be coupled with divergence and momentum decrease on the daily chart, otherwise it can lead to false entry signals that lead to losses.
All the best along your trading journey
Hubert
.


Leave a Reply