How to Analyse and Trade Charts via Step-by-Step Case Study
Dear Traders,
Are you wondering how to properly analyse the charts at every step along the way?
Rather than focusing on theory, this article explains the charts from a practical point of view with in depth comments added to each chart.
This article dives into one chart and takes the reader through the entire decision making process.
Step by Step Analysis of Charts
With this case study, we focus on 4 hour and 1 hour charts. Let’s analyse the GBP/USD back in February 2019. Even though you might be entering the markets using the 4 and 1 hour charts, it is still a good practice to review the daily chart for spotting key support and resistance levels and spotting larger price or divergence patterns as well.
By the way, these examples are all based of and explained in our course called SWAT – simple wave analysis and trading. 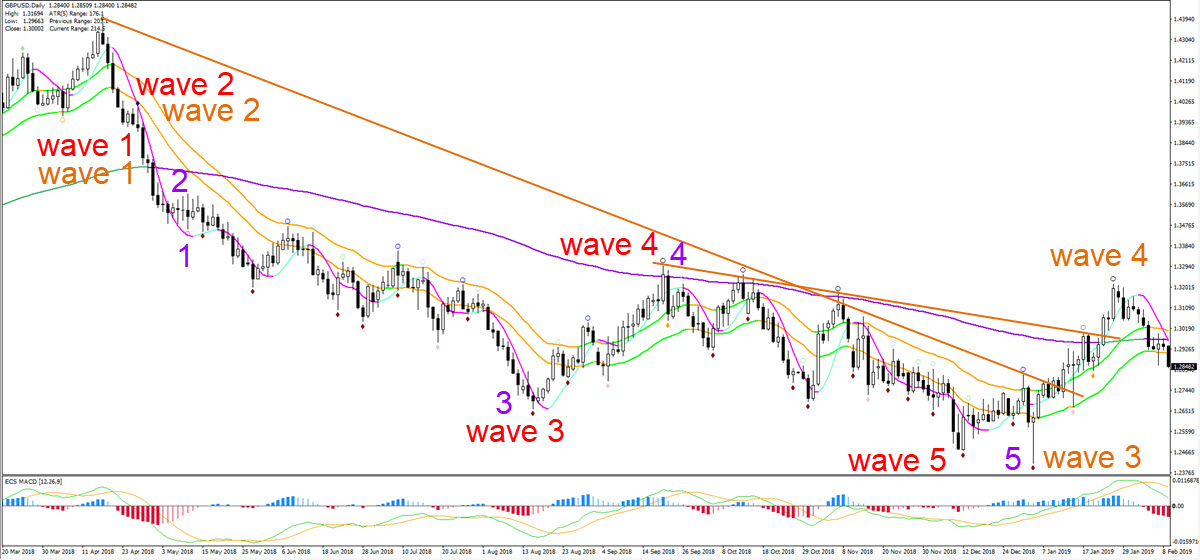
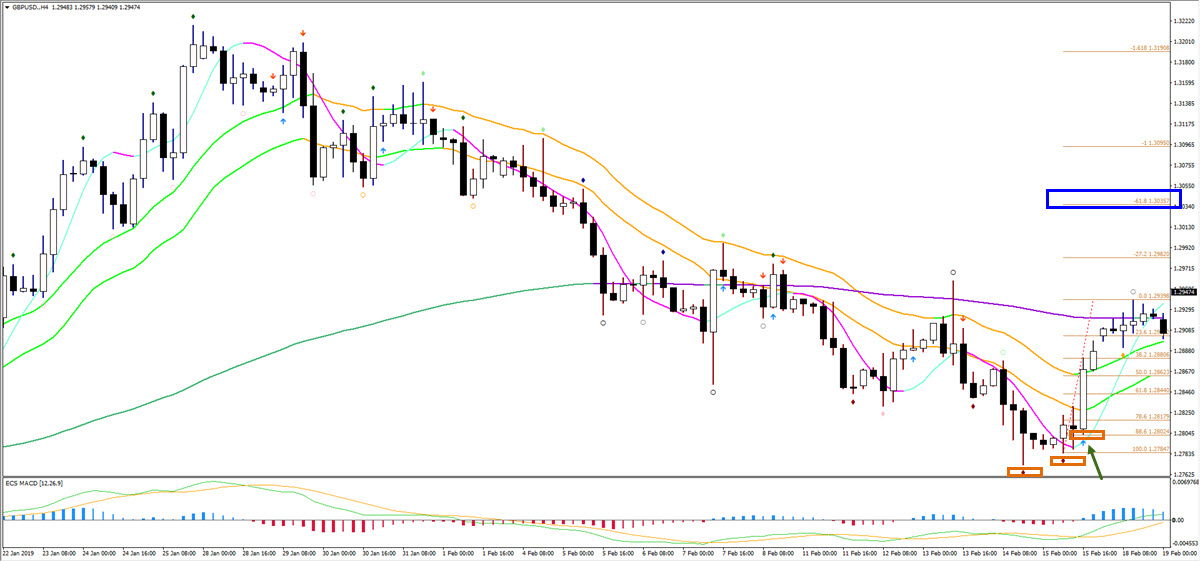
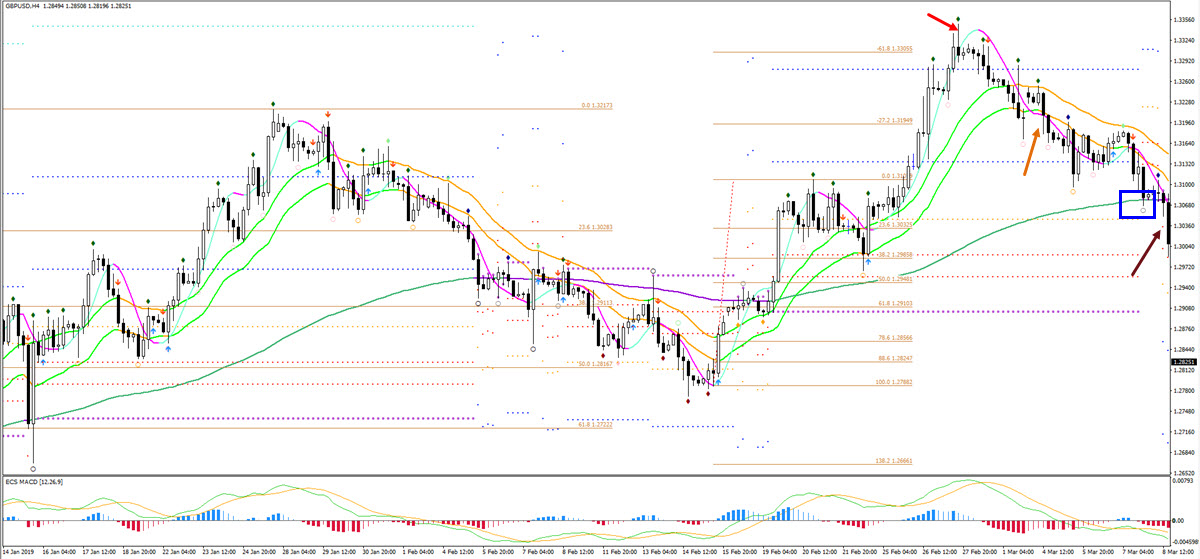
The GBP/USD was in a strong downtrend but as price has remained below the 21 ema and the 21 ema remained below the 144 ema for a long period of time (see image above). From a wave perspective, there are two main scenarios:
- Price has either completed 5 bearish waves (red) at the recent low.
- Or price has completed 5 waves (purple) in wave 3 (orange).
The first scenario indicates a bullish reversal and a potential bullish wave 1 whereas the second outlook indicates that the current upside is just a stronger pullback within the downtrend and a potential (uncompleted) wave 4.
Besides the wave patterns, there are a couple of reasons why price might be ready for a larger bullish retracement or reversal:
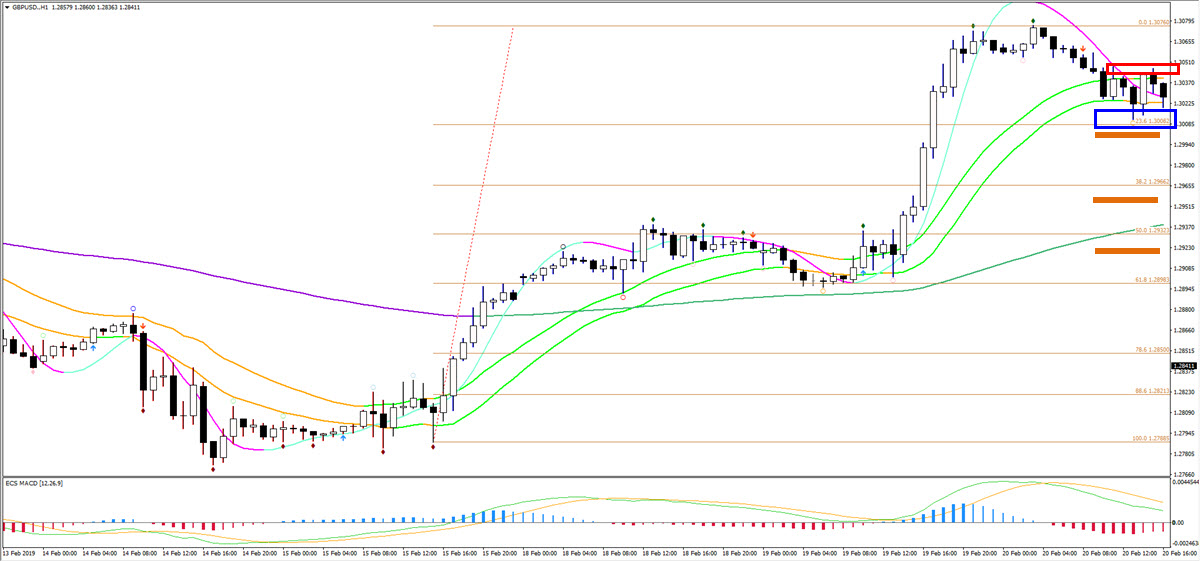
- Price broke above two resistance trend lines (orange in image above).
- There is a double divergence pattern visible between the recent bottoms (see purple lines in image below).
- The strong bullish impulse (blue arrow in the image below) managed to break above the 144 ema close, which could confirm a larger bullish correction such as a wave A of a larger ABC (green) zigzag pattern.

If we are expecting wave A (of an ABC in wave 4) or wave 1 (of a new reversal and uptrend), then in both these cases we can place a Fibonacci tool on the bullish price swing labelled as wave A (green). A wave B will typically bounce and reverse at the 38.2%, 50%, or 61.8% Fibonacci support level for a continuation higher whereas a wave 2 usually bounces at the 50%, 61.8%, 78.6%, or 88.6%. In both wave A-B or wave 1-2 scenarios we are expecting price to make a bearish correction and a bullish continuation. Then depending on how price moves up, we can conclude which of the bullish scenarios (wave C or wave 3) is more likely.
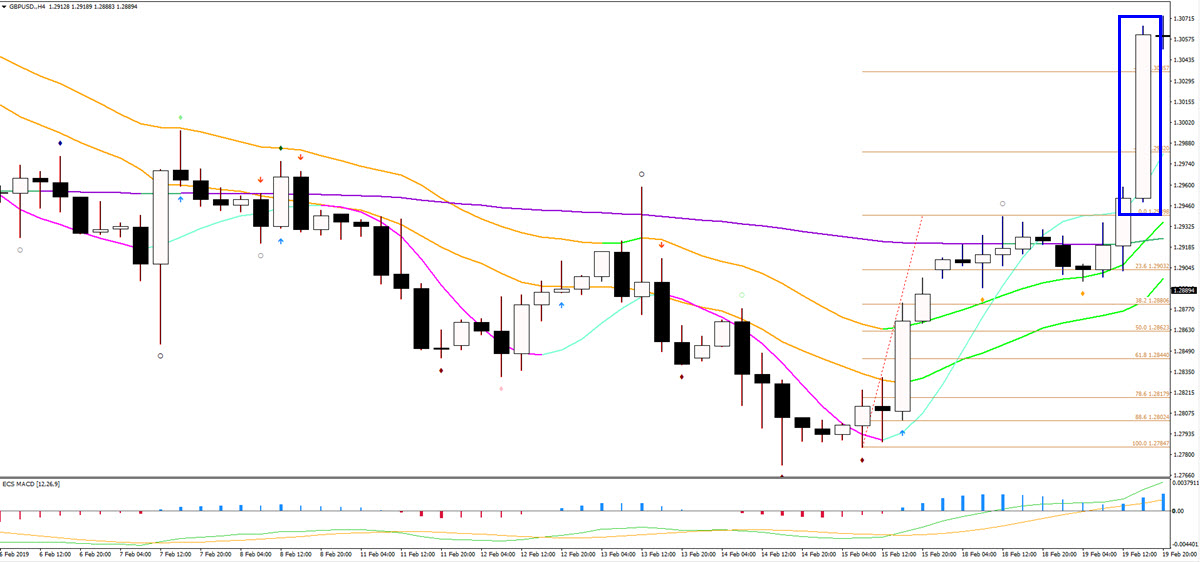
Aggressive reversal traders could think about pending orders at those Fib levels if they really like the odds and potential of a bounce but usually we prefer waiting for bullish candlestick patterns to confirm it. This could be daily or 4 hour candlesticks in this case. Another confirmation could be the break above the 21 ema high of this daily chart but in this case study, we want to focus on trading opportunities on lower time frames so let’s zoom into the 4 hour chart.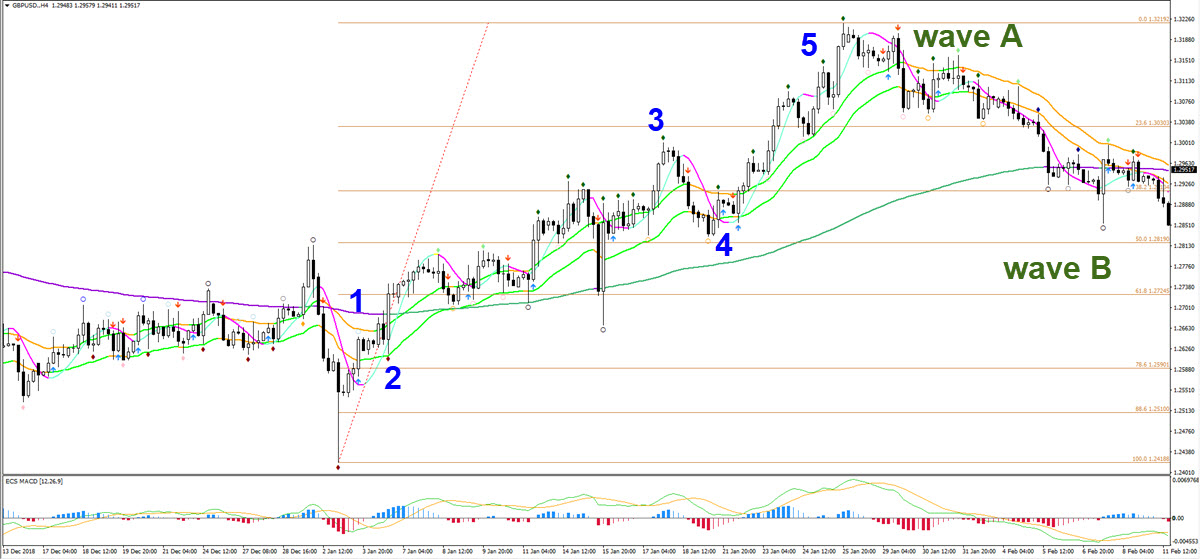
The first thing we notice on the 4 hour chart is the relatively strong bullish price action (blue 5 waves) compared to the choppy bearish correction (wave B green). Since the end of wave A (green), price has been below the 21 ema zone for quite a while but the price is still in between the 38.2-50% Fibonacci levels. This is the bearish correction that we expect from the daily chart.
Traders could try to trade a bullish bounce back up for instance after bullish price action patterns at the Fibs or a breakout above the 21 ema zone. Such a breakout could confirm the end of the bearish swing and the start of a new bullish swing as part of that wave C or wave 3.
As the image above shows, price eventually went a bit lower and reached the 50% Fibonacci retracement level before bouncing back up again. The bullish candlestick pattern (green arrow) was a confirmation of a bounce up. The bullish reaction, however, does not guarantee that the price will actually fully break upwards. The 21 ema zone is still a potential resistance area and more cautious traders are still waiting for a confirmation of a bullish breakout and avoid trading in this zone and any bearish setups. Also, the 21 ema has crossed below the 144 ema so the bearish correction might take longer and be deeper because of that. A bullish breakout above the 144 ema and the resistance line (red) of the downtrend channel indicates the end of the bearish corrective swing and the potential start of a bullish and impulsive price swing.
The next image shows the main advantage of being more cautious. Price tried to break above the 21 ema zone but ultimately failed due to the large wick on top (red arrow) and the failure to close above the 21 ema high. Price pushed lower and seems to be on its way to the 61.8% Fibonacci but then bounced in between the 50-61.8% Fib. What happened? Fibs work very well but in some cases price can miss levels. Also, it could be that this bearish correction is a wave 4 rather than a wave B and we need to remain flexible as traders about what to expect. In any case, just a bit after the bounce up, price shows a strong bullish candle (green arrow), which looks like a proper breakout candle. 
Traders who are looking for confirmation could use this candle for entry, because price also managed to break above the 21 ema high. It was also the 6th candle that did not break the low, which is indicating a time pattern, the possibility that the bearish swing is completed and the potential for a bullish swing.
Here is an overview of the trade setup details:
- An entry can be done on the close of the candlestick (with green arrow).
- Stop loss below the candle low or below the support Fractal, or below the 2nd Fractal back.
- There are several options for targets:
- Keeping it open and waiting for more price information before deciding because the trade is with the trend and could break the previous top.
- Aiming for half of the position at a nearby target (blue box) and leaving the other part open for more information.
- Exiting the entire trade at first target and perhaps adding a new position after that.
- Another option could be to use a trail stop loss below the 21 ema for instance for part of the trade.
Price was very close to the 144 ema which is a key decision zone and traders who do not trust this breakout still have other options to consider before entering:
- Waiting for a bounce at the new Fibonacci retracement levels.
- Break above Fractal which is above the 21 ema zone.
- Pullback after breakout.
- Bounce back at the 21 ema zone which is now support.
Price eventually made only a very shallow retracement by already bouncing at the 23.6% Fibonacci level and the top of the 21 ema zone (see image below). That is one of the disadvantages when not taking the original bounce or breakout, price sometimes picks up speed and the trade could be missed.
The good news is that traders have the option of trading the break above the previous swat.FRACTAL (blue box). The resistance spot is key because its a swat.FRACTAL just above the 144 ema, which means that a bullish breakout is confirming a likely reversal (back to uptrend). 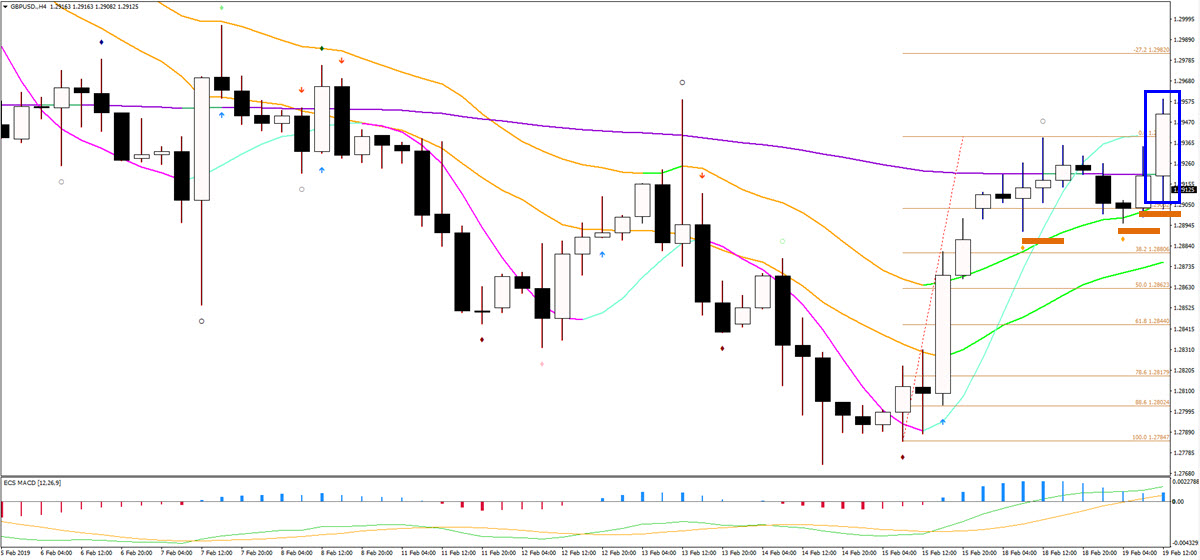
Considering the fact that the breakout candle is strong with a candle close near the high and a decent sized candle too, traders could think about a stop loss at the candle low. Other options of course are also the Fractal or the second Fractal back. Aggressive traders could have potentially three positions open if they trade the bounce, first breakout, and second breakout. Now it’s time to wait and see how the trades develop and if price patterns emerge. Based on that new decisions could be made such as:
- Potential for more trading opportunities.
- Adding targets to current setups.
- Moving trail stop losses to current setups.
The continuation candle is massive (blue box of image above) and shows a lot of strength:
- The candle length is one of the, if not the, biggest candle on the chart.
- The candle close is also near the candle high, which indicates that bulls are strongly in control.
Traders who have open trade setups could use the candle low as a natural barrier for moving the stop loss. Such a strong candle usually does not get broken and is a good spot to either reduce risk, move to break-even or lock in profit.
For traders looking to add setups, they could think about a trade at the candle close with a stop loss at the same spot (candle low of breakout candle – blue box) or traders can wait for a pullback or chart pattern before looking for new setups. 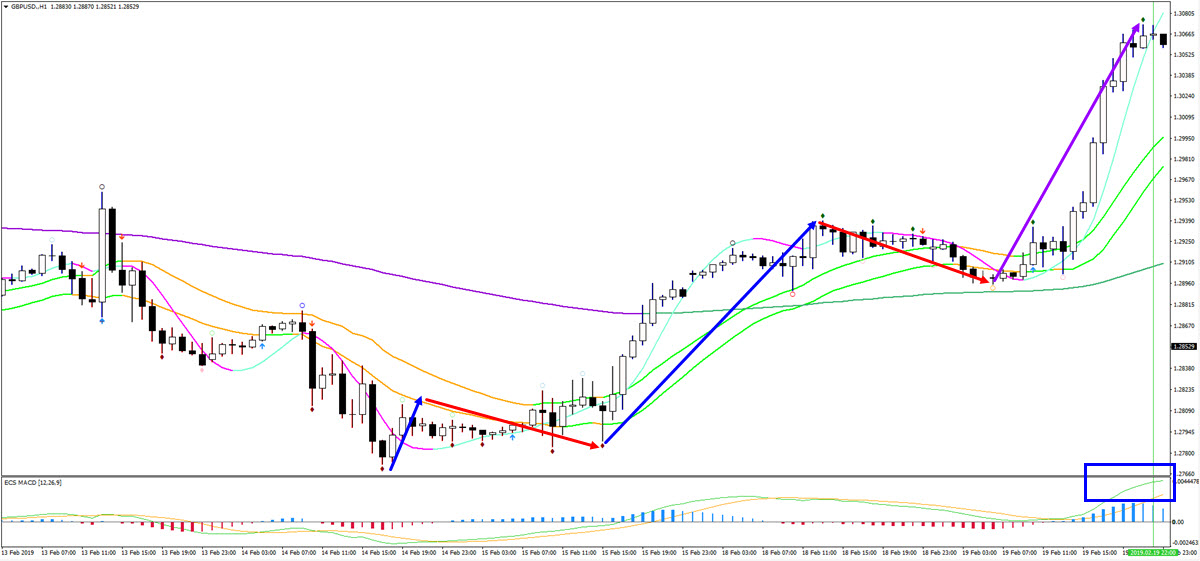
On the 1 chart (see image above) we can try to understand the character of the bullish price action and its wave patterns. The last push up (purple arrow) showed the largest momentum when analysing the ecs.MACD, which means that price has probably made a wave 3. In any case, it seems unlikely that price completed a wave 5 due to the strong momentum and lack of any divergence patterns between the recent tops.
For the moment a bearish correction towards the 21 ema zone could take place and will probably be a wave 4. Alternatively, the price could also keep pushing away from the 21 ema for the moment. In both cases, the 21 ema is expected to eventually act as a support and a bouncing spot. The same is valid for the 144 ema close if price retraces to that level.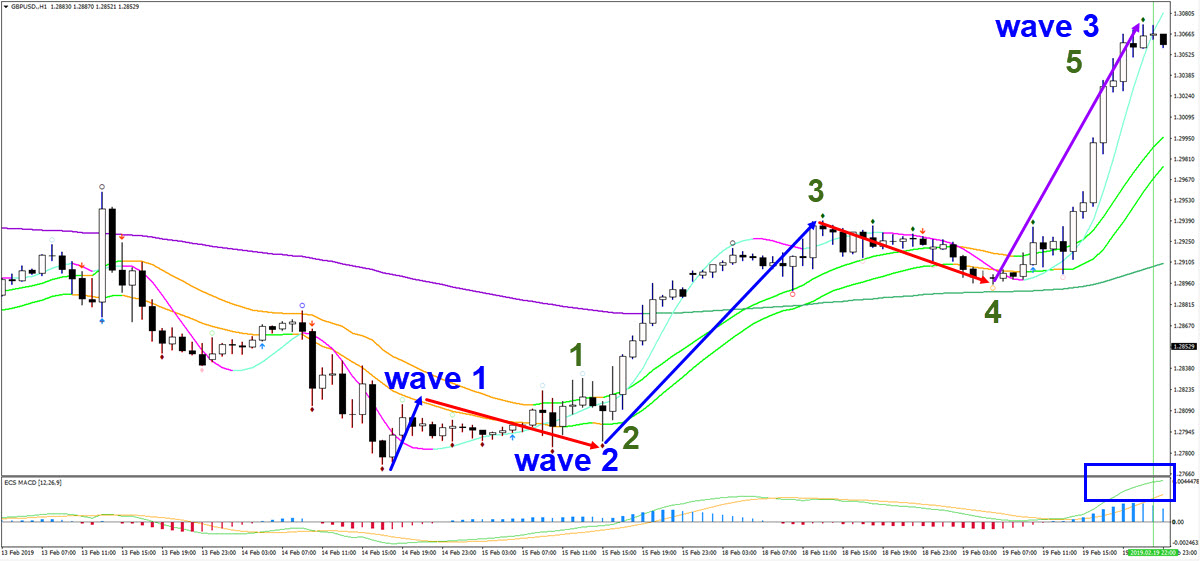
Let’s put a Fibonacci tool on the expected wave 3 (blue) and keep an eye on the retracement levels for potential bounces and continuations. Price eventually did start to make a pullback (see image below) and a bullish bounce occurs at the 23.6% Fibonacci retracement level near the round level of 1.30.
- The bullish engulfing candlestick pattern broke above the 21 ema high and is indicating a potential continuation, which could be a potential setup.
- Also the second break above the 21 ema could be a reason for trading (red box).
- If price were to break below the 21 ema, then the next support zone is the 38.2% Fib.
- The stop loss (orange boxes below) could be below the 38.2%, the 50% Fib, or below the 21 ema, depending how aggressive or conservative you want to be as a trader.
Price indeed bounced at the shallow 23.6% Fibonacci retracement level (see image above ) and broke above the 21 ema high just a bit later (see image below). There was no deeper pullback and price was on its way up, until a clear rejection candlestick appeared (red arrow). The bearish pinbar had a large wick on top, with a clear close near the low, a close below the previous candle close, and showed the potential for a divergence pattern. If we re-analyse the wave patterns, then we might conclude that we missed an internal 5 wave pattern in the most recent push up (blue 5 waves). It could be that a larger wave 4 (green) will take place after price has completed a wave 3 (green). Traders who entered at the 23.6% Fib are best off with exiting and waiting. Traders who entered on the 4 hour chart can still use the same candle low as a trail stop loss level.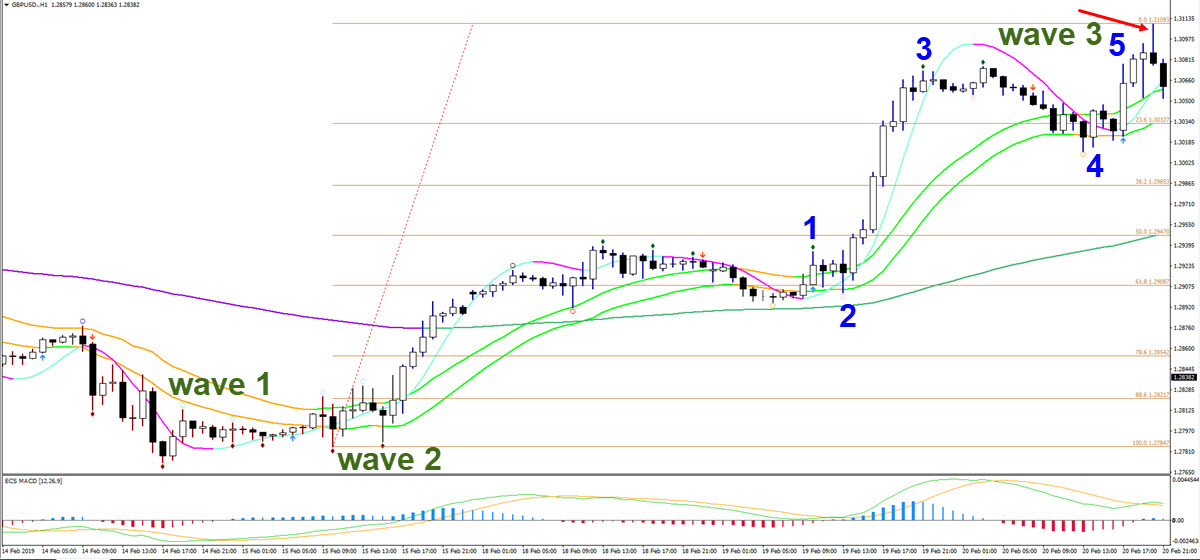
It’s now time to wait for a clear corrective pattern that goes back to the 21 ema or even the 144 ema. If price does break above the pinbar (red wick), then traders could consider trading a bullish breakout if a bull flag chart pattern occurs after the breakout.
Let’s now take a look at the 4 hour chart and see what information is available there.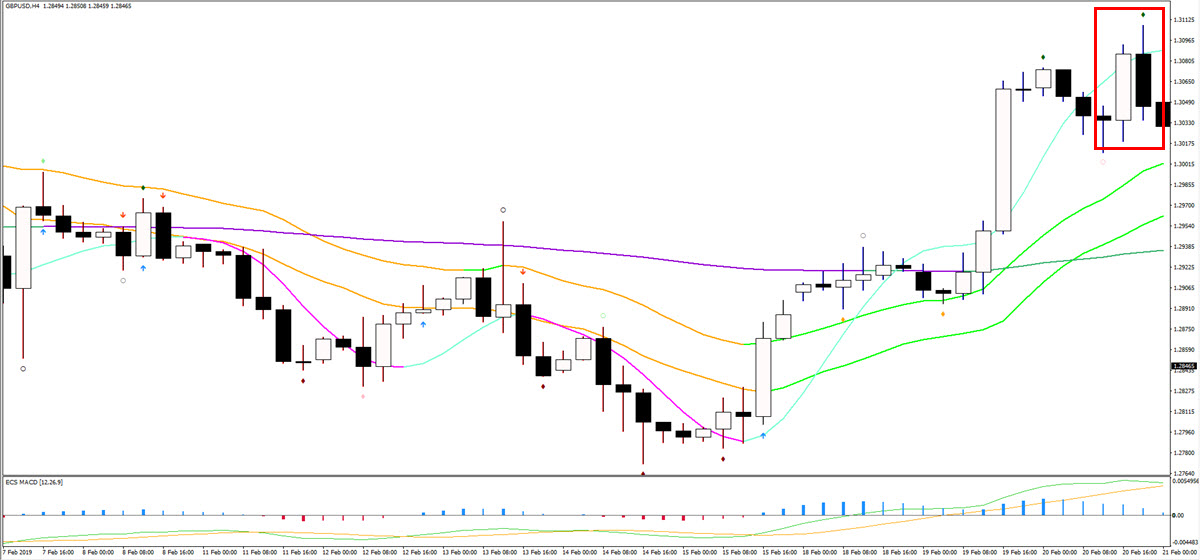
The bearish candlestick is a worrying sign for bulls and price is likely to make a retracement sideways or back to the 21 ema zone. The good news is that the impulse is certainly still bullish (bullish candles remain dominant) and the 21 ema has crossed above the 144 ema in the meantime, which is now confirming a full trend. It is now confirmed that the bearish corrective swing has been completed and the price is in a full uptrend and bullish price swing.
Let’s go back to the 1 hour chart (see image below). We are not interested in the second bullish bounce at the 21 ema (green box) because of the bearish candlestick on the 4 hour chart. Therefore we are expecting price to make a longer sideways correction or even move to the 144 ema close on the 1 hour chart. The divergence pattern on the 1 hour would also support a move back to the 144 ema. Price is now testing the resistance and there is a potential for a reversal chart pattern called a head and shoulders. If price breaks above the resistance (green arrows), then the reversal pattern is invalidated and a bull flag and uptrend continuation would become more likely. Otherwise a bearish bounce and break below the neck (support) line (blue) of the reversal pattern could send price down to the 144 ema.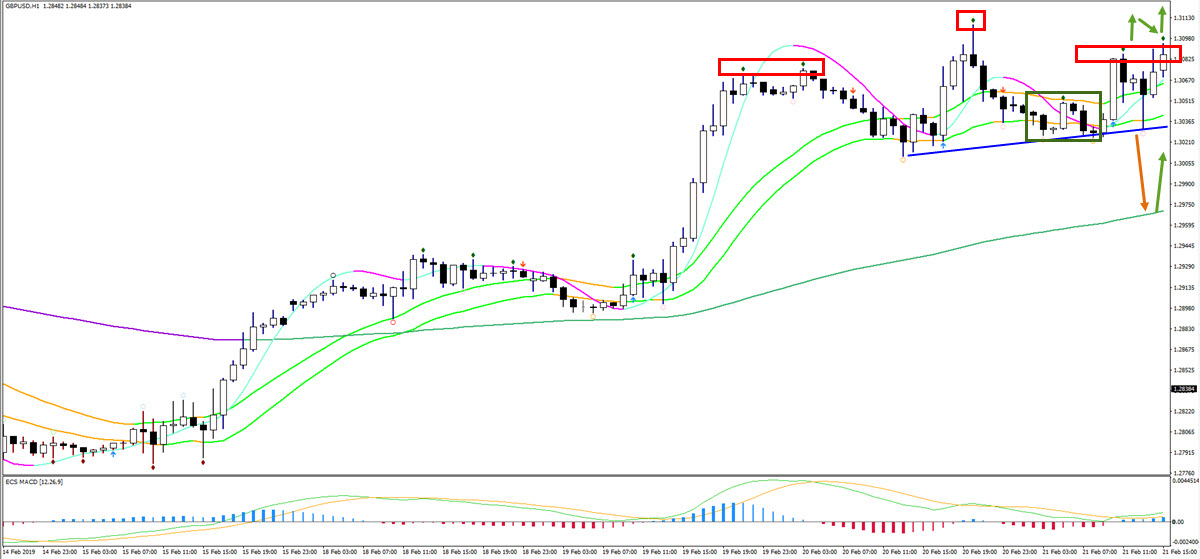
Price did indeed bounce at the head and shoulders level (see image below) and price went back into and eventually below the 21 ema zone. The bearish breakout is 2nd break below the 21 ema (after the top there was a first break) and thus a larger bearish correction is becoming more likely. After that, the price makes a bear flag chart pattern (blue lines) after some bearish impulse (first red arrow). The break below the flag sees price move lower (2nd red arrow) and move down to the 144 ema close and 38.2% Fibonacci level (blue box). This confluence of support was done using a bullish bounce back up (blue arrow) and price then broke above the 21 ema zone for a bullish continuation after retracement.
Traders could have traded several trade ideas here:
- The bearish break of the bear flag towards the 38.2% Fib and 144 ema.
- A support level of 38.2% and 144 ema.
- A bullish reaction and bounce at the 38.2% Fib and 144 ema.
- The bullish breakout above the 21 ema zone.
Traders also have the option of trading these future ideas:
- The breakout above the Fractal at the 21 ema (after blue arrow).
- 6th candle that fails to break the most recent low.
- A Fibonacci level when placing the Fib on the blue arrow.
- The second breakout above the 21 ema zone.
- A break of any future bull flag or triangle pattern.
- Any bullish candlestick pattern on the 4 hour chart.
The 4 hour is shown below. We can see the bullish bounce (blue box) at the 38.2% Fibonacci retracement level and 21 ema zone and a strong bullish breakout candle towering above the 21 ema zone. Also, the ecs.MACD has turned from thick red to thin red, which is indicating the end of the bearish correction and the start of a potential upside.
Therefore, this 4 hour candle could also be a reason for taking a (new) long setup with a stop loss below the support Fractal or below the candle.
Any open trade setups from the past could use the same stop loss as a trail stop loss to lock in more profit. 
Now it is time to think about targets (see image below). The chart shows three different types of targeting:
- The Fibonacci tool on the first swing (green wave A), which is drawn between the two blue boxes.
- The Fibonacci tool on the most recent swing (blue wave 3), which is drawn between the two purple boxes.
- The ecs.WIZZ tool, which is added automatically around the 144 ema close and offers targets above the 144 ema in this case.
The potential profit depends on how aggressive or conservative we want to be plus on our expectations of the uptrend. For the moment, price could either be in a wave C or wave 3 but considering the long-term downtrend on the daily chart and the fact that it remains unclear whether price is in a larger reversal, it could be safer to assume that price is in a wave C. Closer targets are therefore more recommended. The minimum target we expect with a bullish wave C, however, is a break of the previous top so a logical spot to aim for could be the confluence (orange box) of the -61.8% Fibonacci target and the blue dotted line, which is the 5th Wizz level from the purple one (indicated by the green box). The other Wizz levels are old ones and the indicator automatically changes the Wizz levels if price is closer or at the 144 ema. 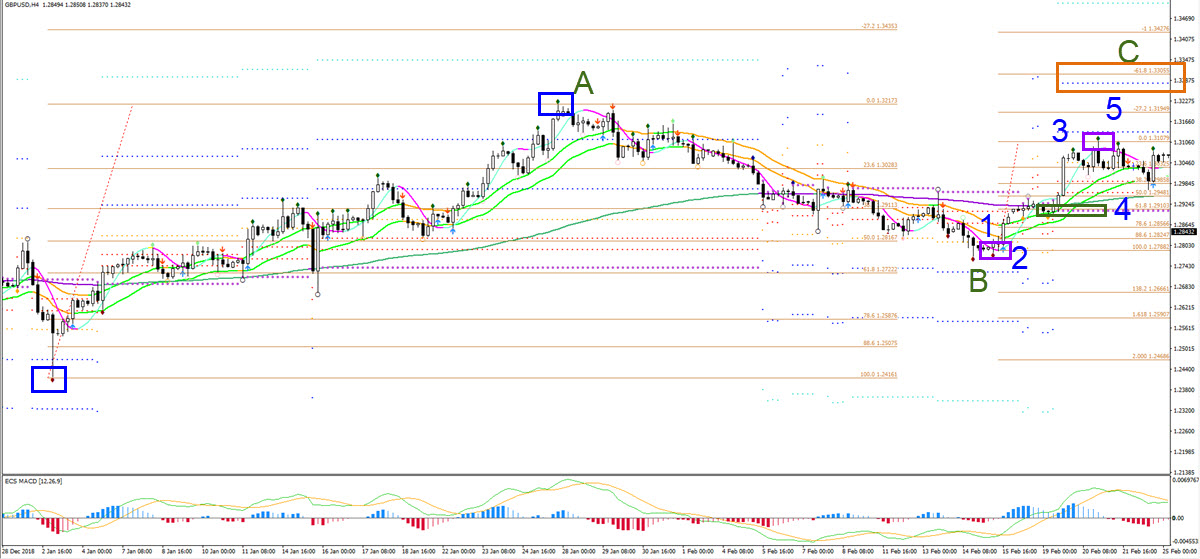
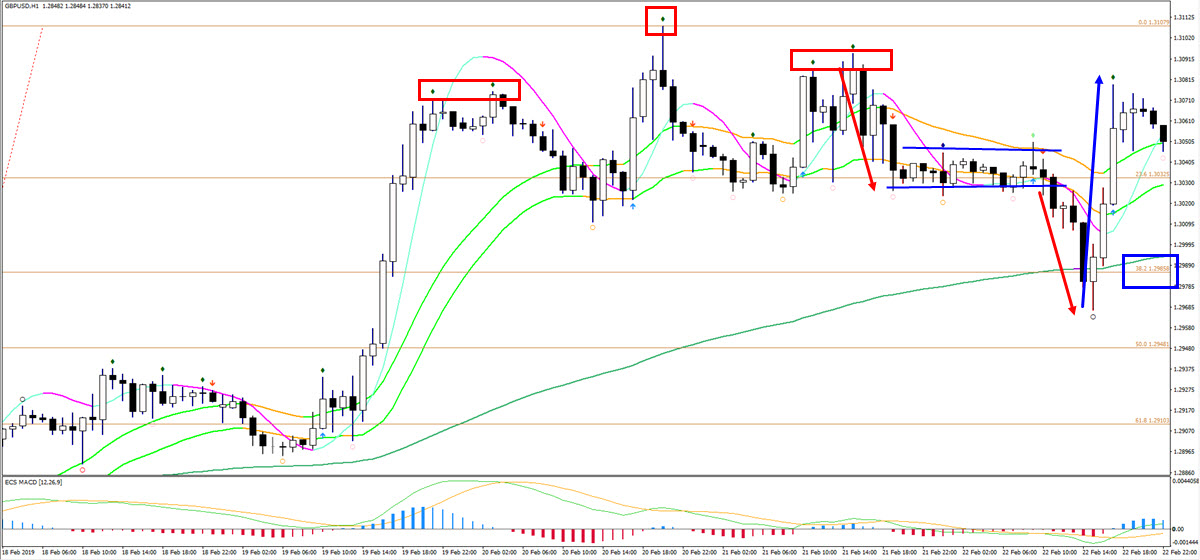
Back to the 1 hour chart (see image below). Price stayed above the 21 ema by going sideways, which is a bearish corrective pattern and indicates that the bulls are likely to push the price up after the break above resistance (red line). The bullish engulfing twin pattern (blue box) after bouncing at the 21 ema zone is likely the clue for a restart of the uptrend. That same candle also has strong momentum as indicated by the thick blue bar on the ecs.MACD. It is also the second break above the 21 ema, which is often a more reliable breakout opportunity then the first breakout.
Price indeed moves higher from that moment and clearly breaks above the 21 ema and resistance Fractals (red line) for a move higher. There is a small bull flag chart pattern (blue lines), which is relatively quickly broken by a candle (green arrow) before moving up to the first target which is the -27.2% Fibonacci target. This target is only expected to be a pausing moment for a larger push up and is aiming for another target at the -61.8% Fib level. 
After that (image below), price made a bearish bounce at the -27.2% Fibonacci target, but it was short lived as price quickly bounced back up again after hitting the 21 ema zone. The 21 ema zone tends to become stronger as a support or resistance zone once price is showing momentum. The angle of the 21 ema is clearly up and the space between the 21 ema and the 144 ema is increasing at accelerating pace. Price then came close to hitting the -61.8% Fibonacci target but missed it by a bit and seems to be retracing back to the 21 ema.
From a wave perspective, the price seems to have completed a potential wave 3 and the pullback could be a wave 4 (green). One more upside towards the -61.8% Fibonacci level is likely, and perhaps even beyond that.
Traders who are in any setups from the very beginning or after the breakout (wave 1 green and/or purple) could be adding a take profit at the -61.8% Fibonacci target and/or using a trail stop loss below the bottom of wave 4 (purple) or below the 21 ema low. 
Price indeed broke above the resistance trend line (red line in image below) after bouncing (green arrow) at the 21 ema zone. The push up (blue arrow) made it to the main and final -61.8% Fibonacci target (blue box) where all potential setups could be closed.
For aggressive traders there is always the chance to move the trail stop loss and aim for a higher level as well.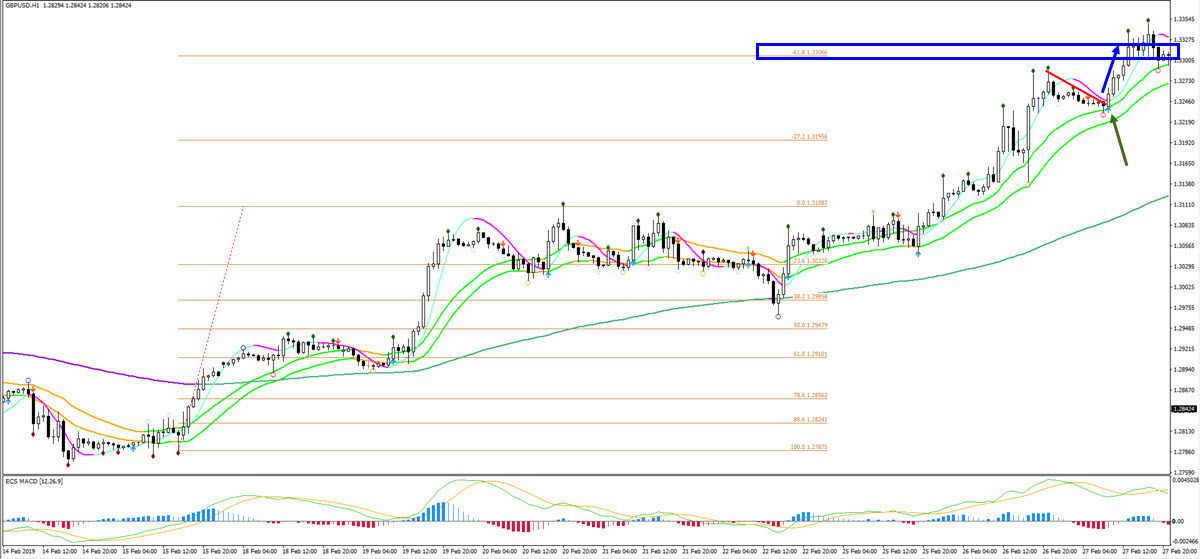
In the end though price indeed did not move much above the main target area (see image below). A bearish candlestick (red arrow) indicated exhaustion of the bullish impulse and started a long move downwards. The first bouncing spot was the 21 ema zone but the second break below the 21 are (orange arrow) indicated at the very least a push lower to the 144 ema zone (which is in wave terms often an ABC or 123 if there is a reversal). Eventually price made it to the 144 ema (blue box) but there are signs of a larger correction or reversal as price breaks below that as well (dark red arrow).
This wraps our second case study on the GBP/USD but before we move on to the next chapter, which discusses SWAT methods in more detail, we will show how the charts looked like with the SWAT indicators.
On the 4 hour chart the opportunities arrived with the two blue candles. The first one (green arrow) was a good one because our analysis indicated that a larger bullish continuation was likely. The second one (blue arrow) was another opportunity as price showed a new blue candle and blue arrow. The ecs.MACD also confirmed the retracement and continuation (see purple arrow). Trail stop loss options were the Fractals, 21 ema, and Fractals at 21 ema (orange/red boxes) if the targets were not used.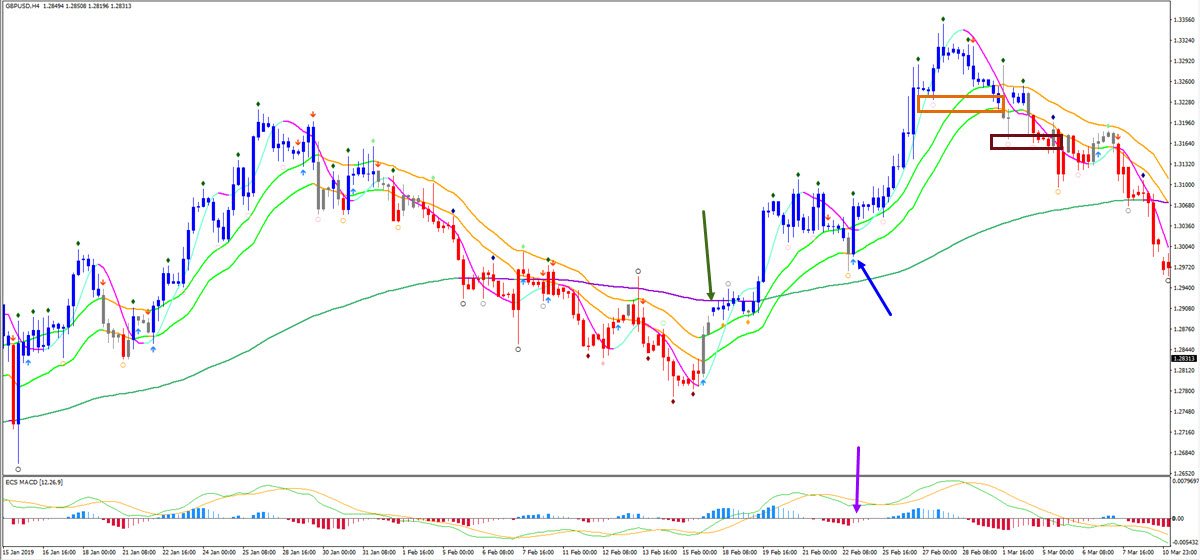
On the 1 hour chart (see image below), there were even more opportunities for trading this move up. The first trade setup (blue box) was still counter-trend on the 4 hour chart and also the 1 hour chart. But the other trade setups already had the moving averages aligned with the 21 ema zone above the 144 ema. The best trade setups are indicated by the green boxes as price confirmed a new blue candle. The red box was a setup which we indicated as a risky breakout due to the head and shoulders reversal pattern. The purple box was a potential scale-in but only had a blue arrow and not a new blue candle plus the price was already quite close to the target as well.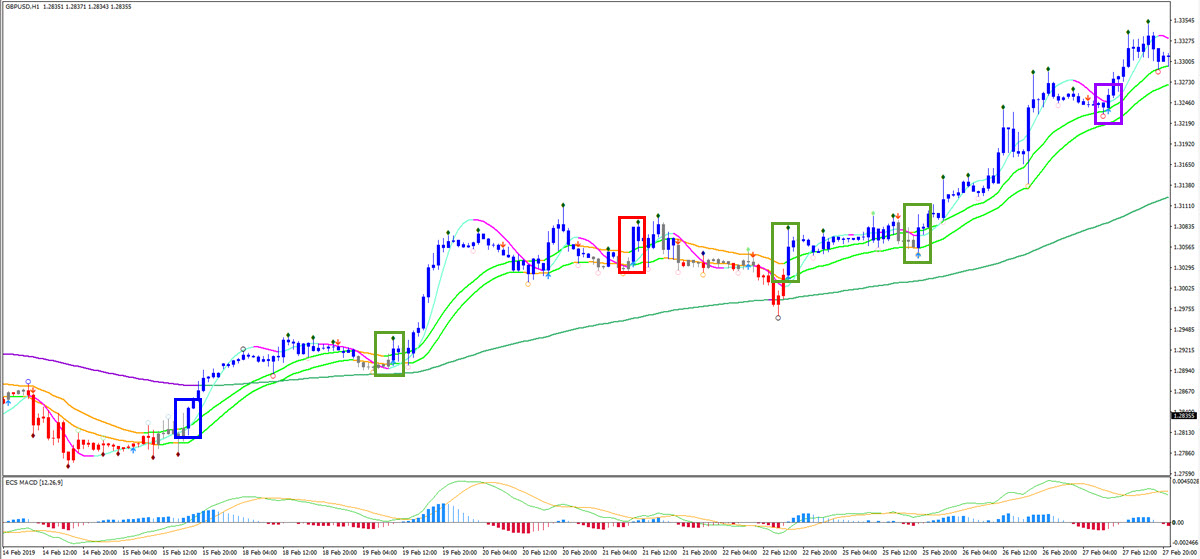
For more information, free analysis, webinars, videos, tools, systems, and methods for trading stocks, cryptos, Forex and options, please check out our website www.EliteCurrenSea.com.
Wish you good trading,
Chris Svorcik


Leave a Reply