Fibonacci Swings with the Fractal Indicator (part 9)
Subscribe

Our focus remains centered on Fibonacci as Elite CurrenSea continues this week with Fib part 9. Establishing the correct / best swing high and swing low is an essential task of the Fibonacci trader because it determines entry levels, exit levels, invalidation and stop losses levels (topic for next month). All of them are obviously crucial elements…
In the previous 2 posts we discussed how to use the Fibonacci targets and the Awesome Oscillator (AO) for determining swings, but this time around our eyes are on focused on the Fractal Indicator.
FRACTAL INDICATOR
The Fractal Indicator is a simple indicator which shows support and resistance on each time frame and chart.
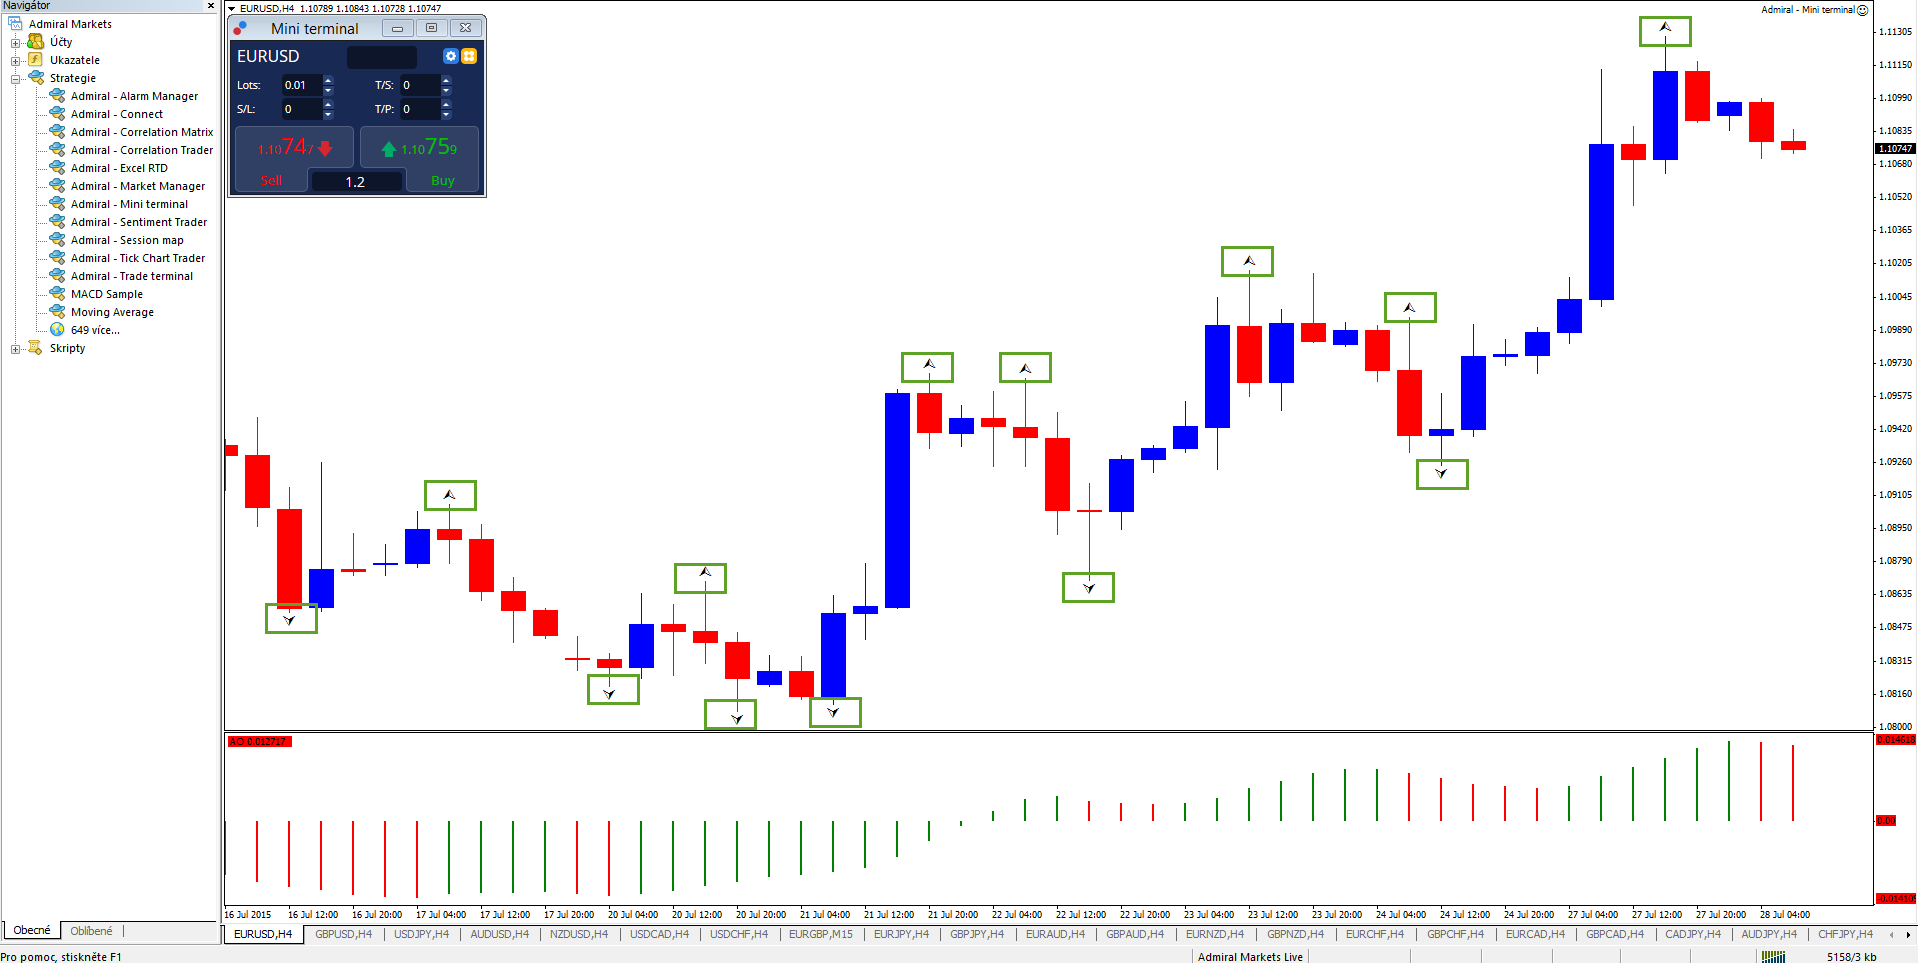
The Fractal is added to the graph automatically by the indicator in the following moments:
1) Above the candle: there is a candle high which is higher than the highs of the 2 candles to the left of it and 2 candles to the right of it (highest high of a group of 5).
2) Below the candle: there is a candle low which is lower than the lows 2 candles to the left of it and 2 candles to the right of it (lowest low of a group of 5).
The 2 candle rule is the very minimum and has no maximum (there could be 10 or 30 candles lower or higher). Also, the 2 candles to the right must be closed candles before the Fractal is confirmed otherwise an open candle can push beyond the high or low and invalidate the potential fractal.
The standard setting is automatically set on 2 when a trader is using the MT4 platform and applying the Fractal Indicator to the chart.

FIBONACCI AND FRACTAL
The high or low of the fractal candle becomes an important support and resistance (S&R) level once both sides have 2 candles that are lower (fractal on top) or higher (fractal on bottom). That candle high or low gets ‘promoted’ by becoming the highest high or lowest low of a group 5 candles or more.
Conclusion 1: the fractals therefore become a quick and simple method of spotting turns – or start and end of swings.
Conclusion 2: a Fibonacci trader can then use those swing points to their advantage and utilize the support and resistance levels to place a Fibonacci tool on the chart.
Conclusion 3: this could simply be completed by using 1 resistance fractal and 1 support fractal. A Fib trader can use the 2 fractals for identifying both the start and end points of the Fibonacci tool – as shown below.

DRAWING THE BEST FIBS
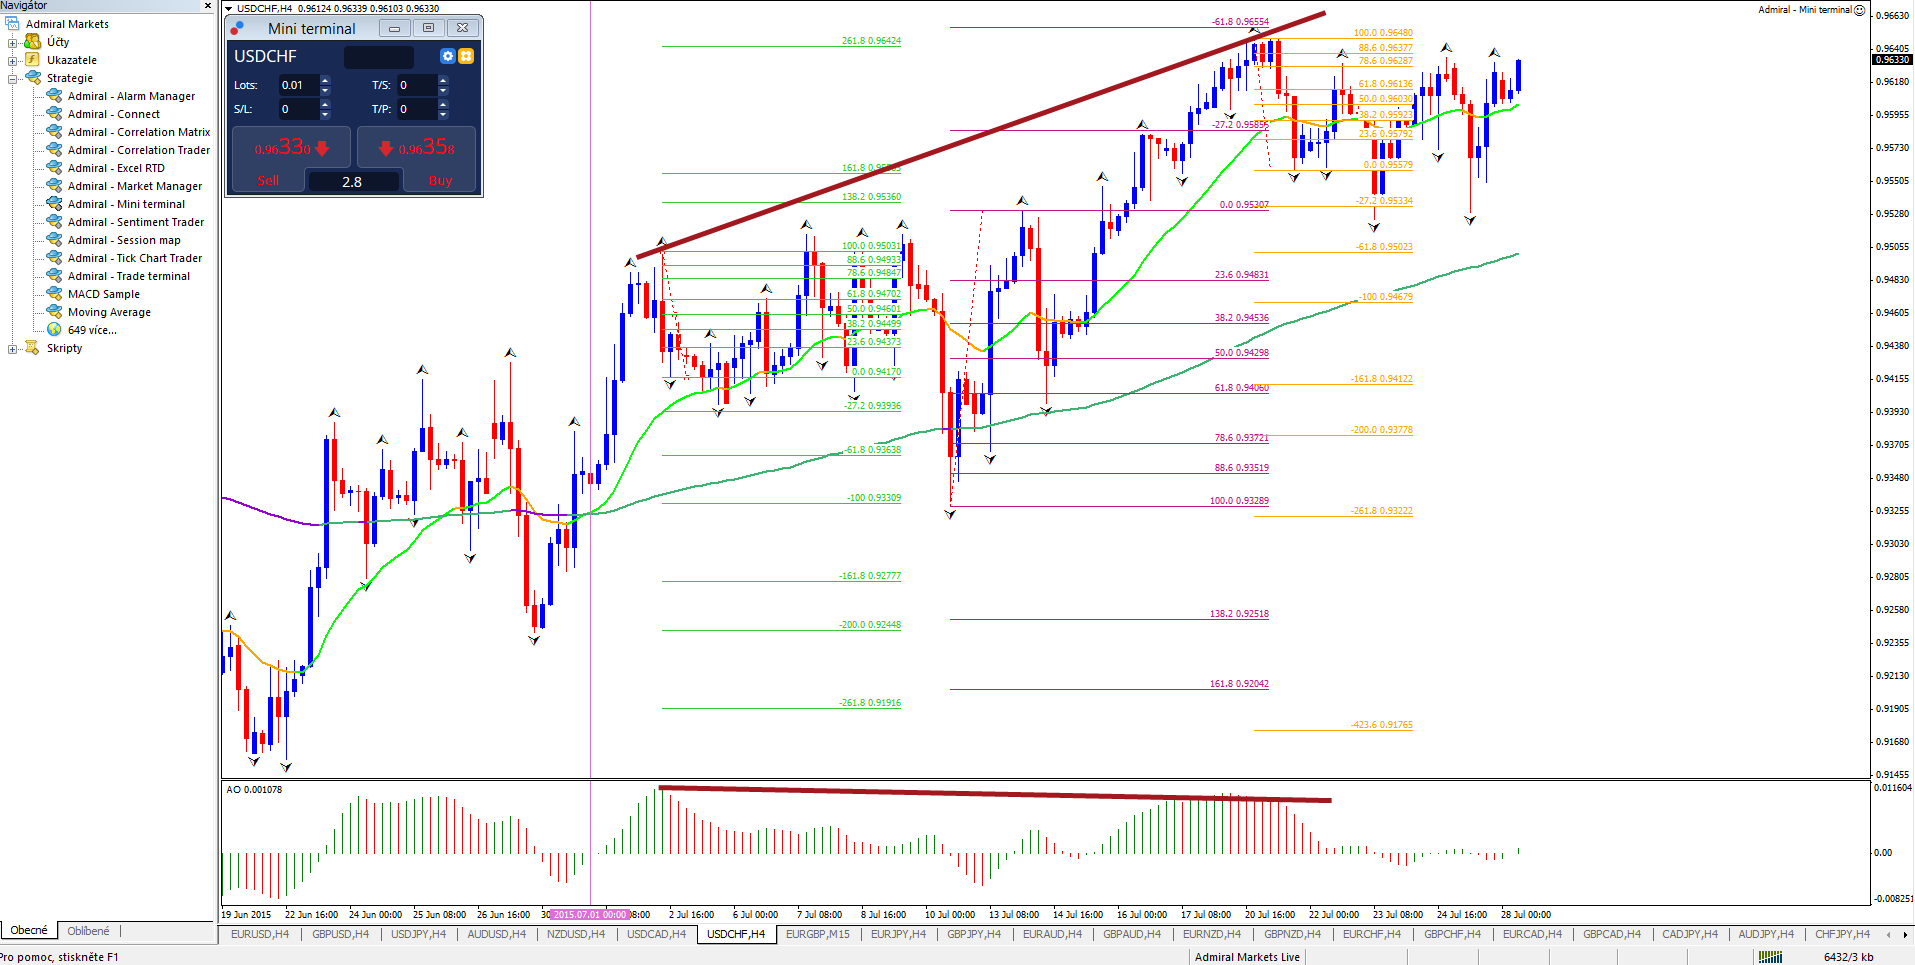
In theory the Fibonacci tool can be drawn on any 2 fractals… But the Fibs aligned with the trend provide the best results. Another good place for a Fib is the ABC zigzag correction.
Let’s take a look at an example: uptrend on USD/CHF 4 hour chart. The fractals offer many turning spots and support and resistance levels. Once the moving averages are aligned for an uptrend then the trader can place the Fib tool on the cahrt. They are best served by placing the Fib tool from support fractal to resistance fractal and waiting for a discount to enter (purple Fib). Placing it from top to bottom makes sense for finding retracement targets on the chart (green Fib).
The exception is when a Forex trader is anticipating a reversal due to the presence of for instance (multiple) divergence(s) on the charts (orange Fib). Placing the Fibonacci levels from resistance fractal to support fractal to catch a bearish correction of the uptrend has long-term potential (the support to resistance for a bullish correction of a downtrend). In general these reversal trades are more difficult to recognize and require a more experienced eye.
PROBLEMS WHEN FIBBING
There are a couple of issues which Forex traders can encounter during their Fibonacci adventures. One of them is trading with the trend but using a small swing within a larger swing. Such an example can be found on the previous chart but for clarity purposes I added it below.
1st issue: the main swing is indicated by the green Fibonacci tool which uses key fractals. The next Fib tool (orange) also uses 2 fractals BUT there is a major difference: that swing is entirely part of the previous swing. Or in other words using too many Fibs on 1 spot of the chart can turn out to be dangerous (explained here). That is evident on the next Fib (purple) which sees a break of the bottom.
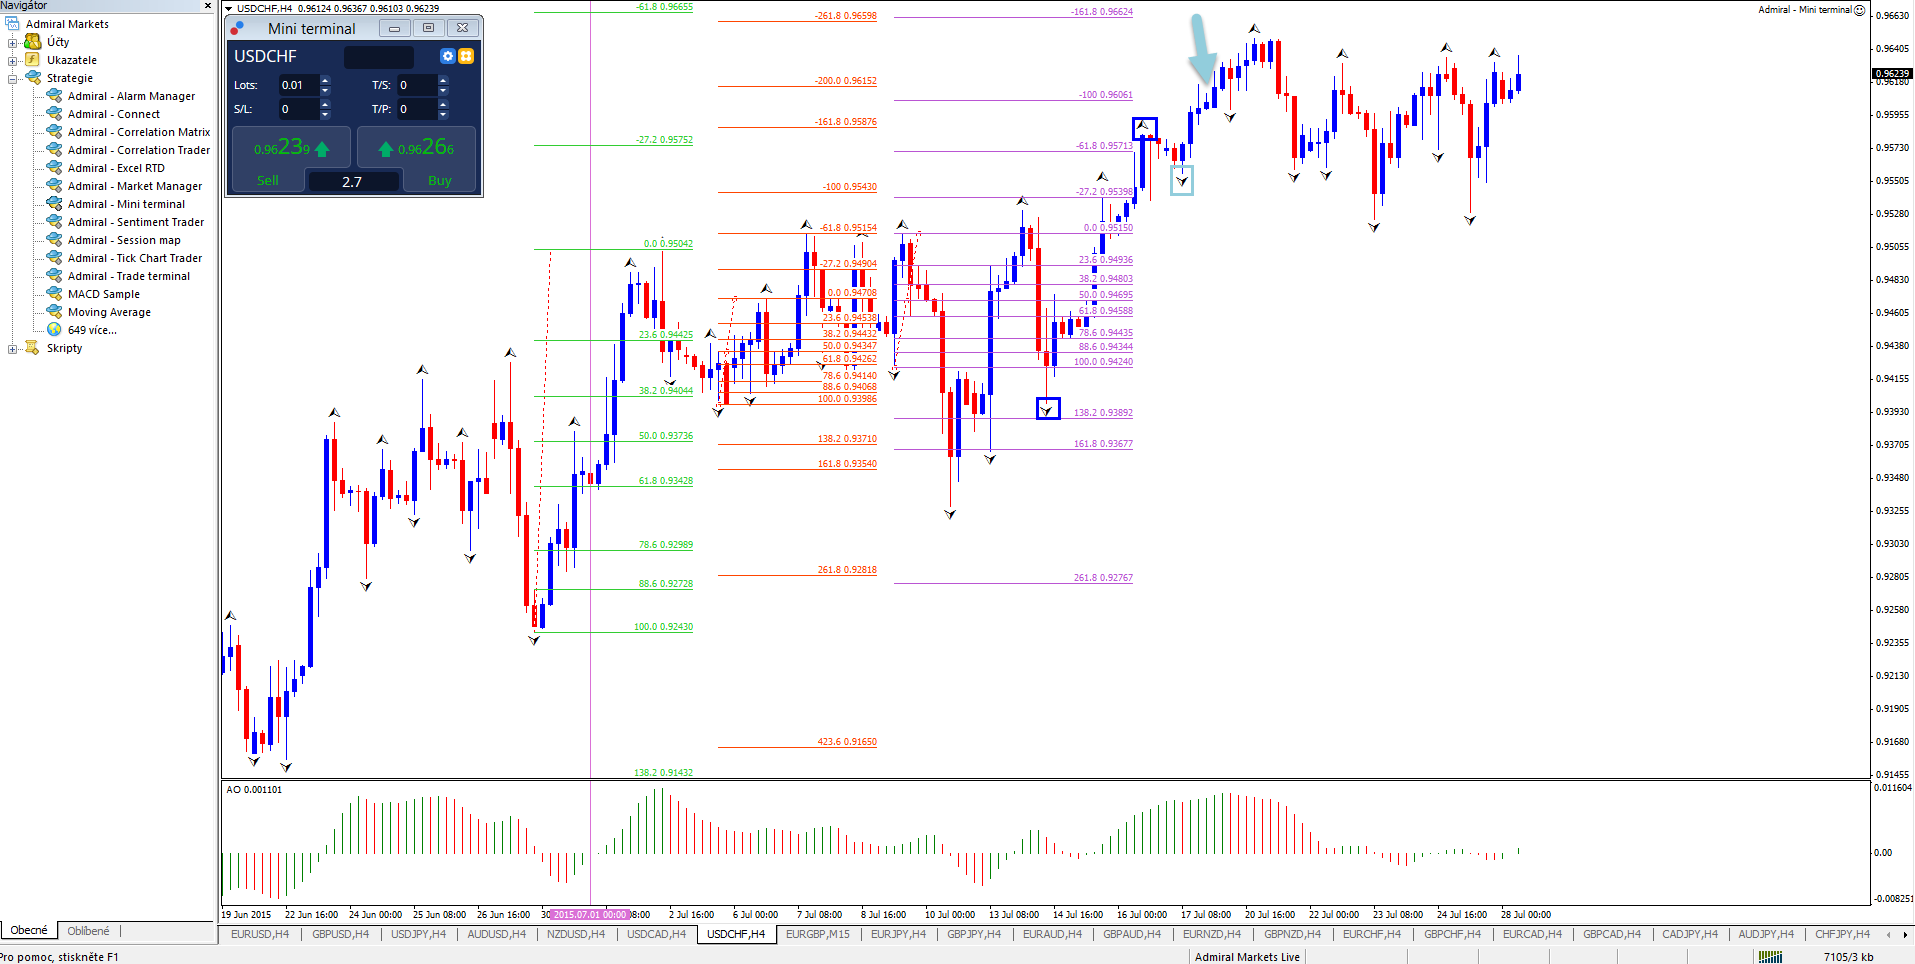
2nd issue: Last but not least, waiting for the fractal (2 candles to the right) to get confirmed leads to missing the entry. An example is provided in the screenshot above where the light blue box shows the Fractal on the bottom. The support fractal is only confirmed at the open of the candle with the blue arrow. This means that the Fib between the most recent bottom and top (dark blue boxes) is already redundant before it was noticeable with Fractals.
Before leaving, make sure to read our entire Fibonacci series!
Good trading!


Leave a Reply