Determine Confirmations & Invalidation Levels on Price Charts
Subscribe
Dear Traders,
Are you sometimes unsure when and where your trade is invalidated and when its actually confirmed?
Luckily, there are precise methods to find both levels and patterns that confirm our analysis and our trading ideas & setups.
This article explains what we mean with confirmation and invalidation, how to spot these levels and patterns, and how to trade breakouts and bounces. Let’s start.
Confirmation & Invalidation Levels & Patterns
A decision zone is like a point of confluence or point of control (POC), which indicates that there are multiple factors that indicate the importance of a price zone.
POCs are often used to indicate that there are multiple support or resistance (S&R) levels at one price zone, which makes that particular S&R more important.
We use these decision zones for identifying confirmation and invalidation levels and patterns:
- Confirmation pattern: confirms a particular price pattern in the decision zone.
- Confirmation level: confirms a particular price level in the decision zone.
- Invalidation pattern: the expected pattern is not working out and invalidated.
- Invalidation level: the key level is broken and invalidated.
Confirmation and invalidation are important concepts for traders and analysts because they provide clarity about these aspects:
- The price patterns and market structure
- Your chart analysis of the market
- Your trade setup and trade management
Confirmation and Invalidation of Price Patterns
Price patterns do not provide 100% certainty. A pattern could get confirmed and behave in the way we would expect it to. But patterns can also ‘fail’ or ‘collapse’ and the price path could turn out to be different than expected.
Both a pattern and the expected price path can become confirmed or invalidated depending on how price moves and behaves at key levels or price zones:
- A price pattern can be confirmed by an expected pattern and if price moves at the expected level.
- A price can be invalidated by an unexpected pattern and if price breaks the expected level.
Both continuation and reversal patterns have their confirmation and invalidation levels. When price breaches such a key level, then traders are receiving a warning signal:
- Break of an invalidation level indicates pattern failure.
- Break of a continuation level indicates pattern confirmation.
The invalidation and confirmation level of each price pattern is different. Let’s start with the continuation patterns:
- Bull or bear flag pattern:
- Confirmation: break beyond the flag.
- Invalidation: break below the 50% Fibonacci level.
- Confirmation: break beyond the flag.
- Contracting triangle pattern:
- Confirmation: break into the expected direction beyond the support or resistance.
- Invalidation: break into the unexpected direction beyond the support or resistance.
- Confirmation: break into the expected direction beyond the support or resistance.
- Sideways range or consolidation:
- Confirmation: break into the expected direction beyond the support or resistance.
- Invalidation: break into the unexpected direction beyond the support or resistance.
- Confirmation: break into the expected direction beyond the support or resistance.
- Ascending and descending triangle:
- Confirmation: break into the expected direction beyond the support or resistance.
- Invalidation: break into the unexpected direction beyond the support or resistance.
- Confirmation: break into the expected direction beyond the support or resistance.

- Cup and handle pattern:
- Confirmation: break into the expected direction beyond the support or resistance.
- Invalidation: break into the unexpected direction beyond support or resistance.
- Confirmation: break into the expected direction beyond the support or resistance.
Let’s now review reversal patterns:
- Double bottom or top:
- Confirmation: break into the expected direction beyond the support or resistance.
- Invalidation: break into the unexpected direction beyond the support or resistance.
- Confirmation: break into the expected direction beyond the support or resistance.
- Triple bottom or top:
- Confirmation: break into the expected direction beyond the support or resistance.
- Invalidation: break into the unexpected direction beyond the support or resistance.
- Confirmation: break into the expected direction beyond the support or resistance.
- (Inverted) head and shoulders (H&S) pattern:
- Confirmation: break into the expected direction beyond the support or resistance.
- Invalidation: break into the unexpected direction beyond the support or resistance.
- Confirmation: break into the expected direction beyond the support or resistance.
- Falling or rising wedge:
- Confirmation: break into the expected direction beyond the support or resistance.
- Invalidation: break into the unexpected direction beyond the support or resistance.
- Confirmation: break into the expected direction beyond the support or resistance.
Confirmation and Invalidation of Your Setups
Similar to the chart and price patterns which can be confirmed or invalidated, the same logic applies to your potential trade setup (entry) and open trade setup (trade management).
The confirmation and invalidation levels provide important information about whether price is continuing with the pattern as expected or whether perhaps a different pattern is valid. But although the invalidation and confirmation levels are key, they are not unbreakable patterns.
A breakout confirmation pattern could fail and so could an invalidation pattern. The best way to measure whether price is indeed confirming a confirmation breakout or an invalidation is via these three ways:
- Measure whether the candlestick closes near the high or low.
- Compare the candlestick size to candles in the recent past.
- Realise that the patterns are impossible to forecast with 100% accuracy.
Let’s review all of these key factors.
Candlestick close
We measure the success of a breakout by simply monitoring the strength of the candle close. A strong candle close is when the candlestick closes near the high or low.
Here is how a candlestick close works together with a breakout setup:
- A strong bullish breakout is indicated by a candle close near the high.
- A strong bearish breakout is indicated by a candle close near the low.
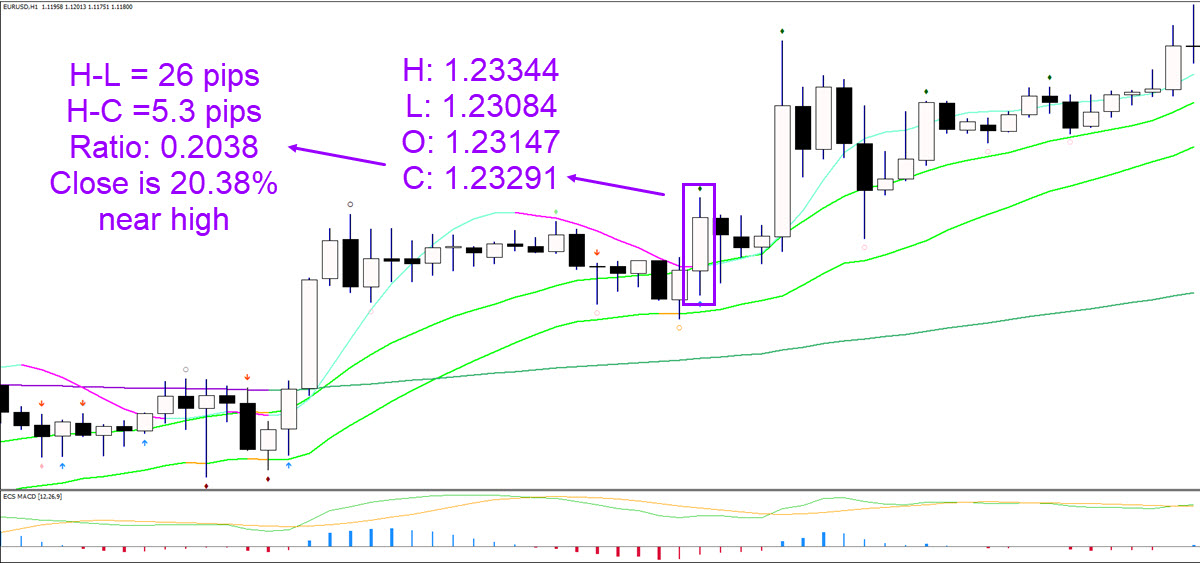
Here is how you can measure the strength of the breakout candle:
- Calculate the candlestick length like this: high minus low (high – low).
- Calculate how far the close is from the high or low:
- Bull break: candle high minus close.
- Bear break: candle low minus close.
- Compare close (point 2) with candle length (point 1):
- Example: total candle size is 60 pips. The close is 20 pips away from the high or low. Then the close is 33% away from the high or low (20/60 = 33%).
Here is how we rank the candle closes:
- 0-5%: extremely strong. The close is almost right at the high or low which is indicating extreme strong candlestick close. The bulls or bears have a dominant and clear control of the candle.
- 5-10%: very strong. The bulls or bears have a dominant and clear control of the candle.
- 10-20%: strong. The candle is under control by the bears or bulls but not as dominant as the first two groups. The breakout is strong and most of the time plays out well.
- 20-25%: decent. Breakout should work but analysing other parts of the chart is useful.
- 25-30%: ok – mild. Be careful, the odds of a good break are going down.
- 30-35%: doubtful. Here a breakout is not looking that good and context of the chart is important.
- 33-50%: weak. The breakout is not so successful and traders should keep an eye on the next candlesticks to estimate the directio
- 50-66%: very weak. The breakout is looking bad but a reversal does not look that good either. Best to keep an eye on new candles.
- 66%+: reversal potential.The breakout of the confirmation or invalidation level is not going as planned and there is a potential reversal taking place against the expected direction.
Candlestick Size
Another sign of strength is also visible via the candle size. A larger candle indicates a strong breakout candle than a smaller candle, relative to the candles of that time frame. Although candle size is a factor to consider, I personally think the candle close is more important.
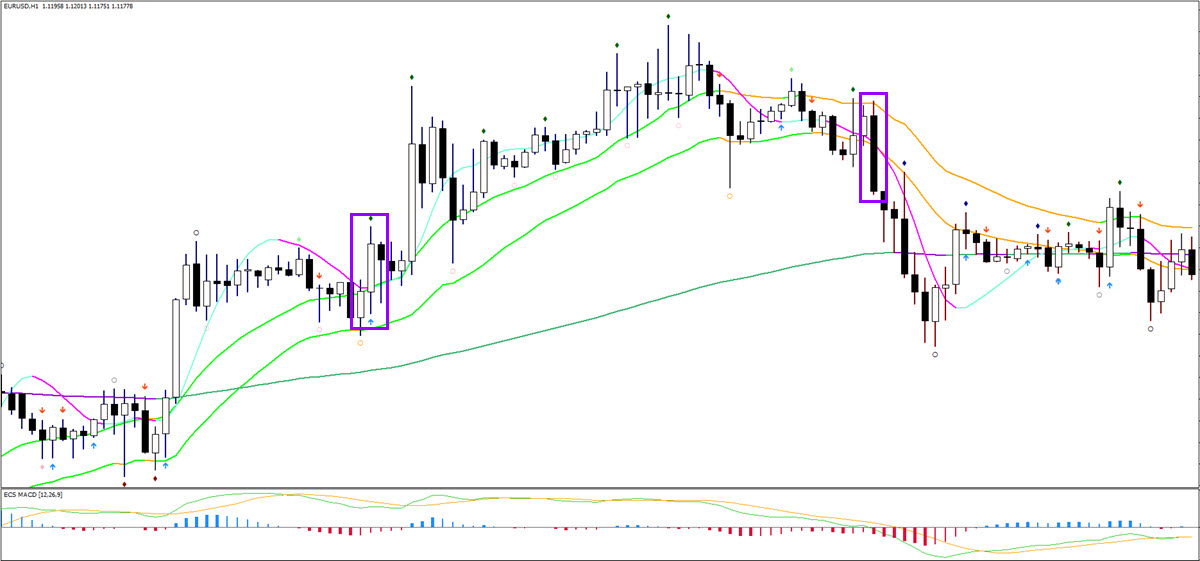
When using moving averages and trend lines (as mentioned in tip 4), it is a useful tactic to review the relationship of price action with the support or resistance (S&R) level. One aspect is mentioned in tip #2, which is that the candle closes near the candle high or low.
Here are a few more vital parts:
- The best breakouts occur when the candlestick closes above the MA or trend line.
- The best breakouts occur when the candle body is above the MA or trend line (50% is decent).
Patterns Are Imperfect
No trader can know for sure whether the breakout will turn into a false break and fail. As always, the market decides and speaks and we traders need to listen and follow – NOT the other way around.
- Many traders fall into the trap of analysing and predicting the Forex markets and then blaming the market for not following their plan. This is not how trading works.
- You need to continuously establish the most likely path of least resistance, which acts as a road map for price. This requires regular updating and is not a fixed path.
- Also realize that breakout trade setups occur after chart patterns have appeared. It is crucial to learn and recognize all of the chart patterns, or at least the most common ones.

Invalidation Levels
Invalidation levels and patterns provide traders with boundaries. If a certain level is hit or a certain pattern unfolds, then they know that their analysis, potential trade or open trade is not doing that well.
Your analysis could be invalidated if for instance price shows impulsive price action rather then corrective price action (pattern). Or if price breaks below the top or bottom (level). If your analysis is invalidated, then you need to re-analyse the chart and try to understand what new scenario is likely.
Your potential trade could also become invalidated by certain patterns or levels. For instance, you could be interested in trading a long setup at the 50% Fibonacci level but if price breaks that zone with strong momentum, then your potential trade setup could be invalidated.
Last but not least, your open trade also could rely on invalidation levels and patterns. Invalidation level is where you hopefully have placed your stop loss level or trail stop loss. An invalidation pattern could be a good reason to exit or manage the setup.
More is explained in our special Elliott Wave Patterns & Fibonacci Relationships Core Reference Guide.
Breakouts and Bounces
My first tip is to make sure that the pattern is visible on the same timeframe. The best level of zoom is when the chart is showing +/- 150-200 candlesticks. Here are the various scenarios that could occur:
- No chart patterns available → move on to the next time frame or pair.
- A chart pattern is available but it extends back into the past → zoom out one time frame to see the full pattern on one chart.
- A chart pattern is available but it’s a very small part of the chart → zoom in one time frame to see the pattern properly on one chart.
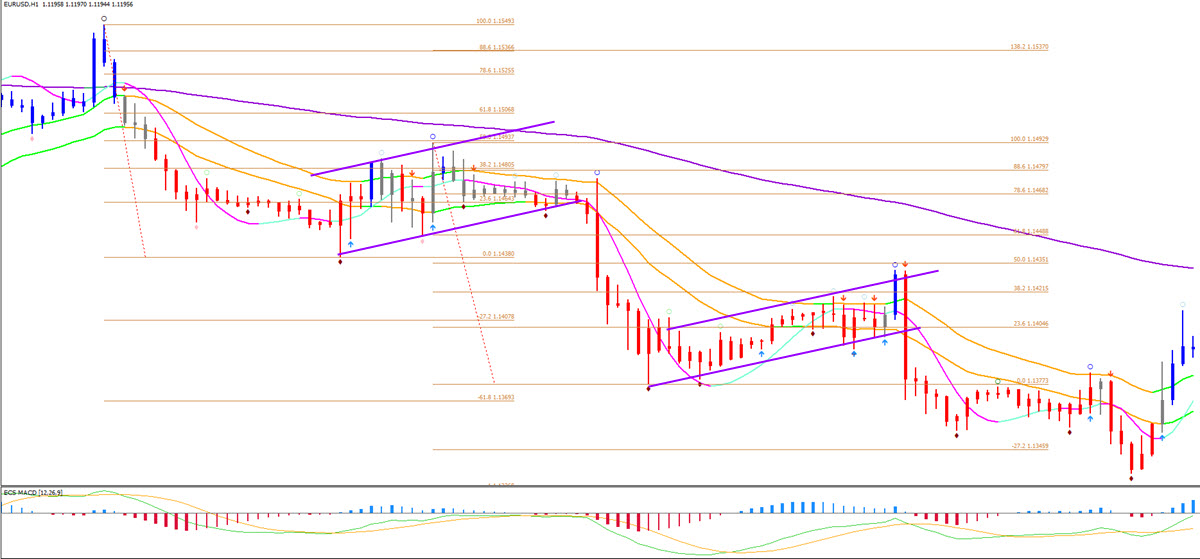
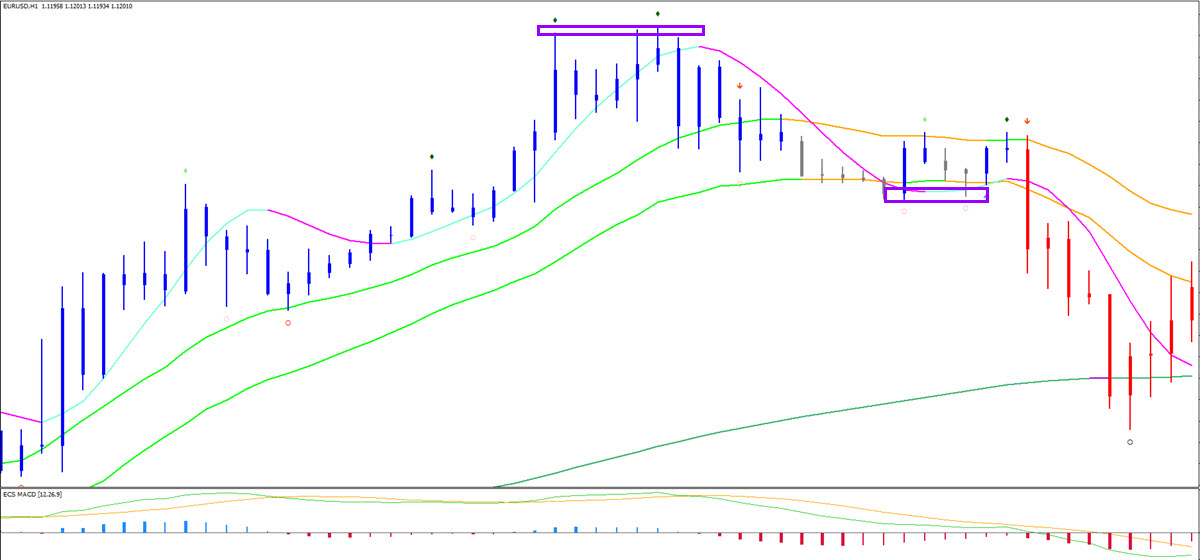
Finding the correct time frame is where many traders start off wrong with their breakout trading system. Once you find a pattern on the correct time frame, we can move on to step 2. Here below is a relatively small but still acceptable chart pattern.
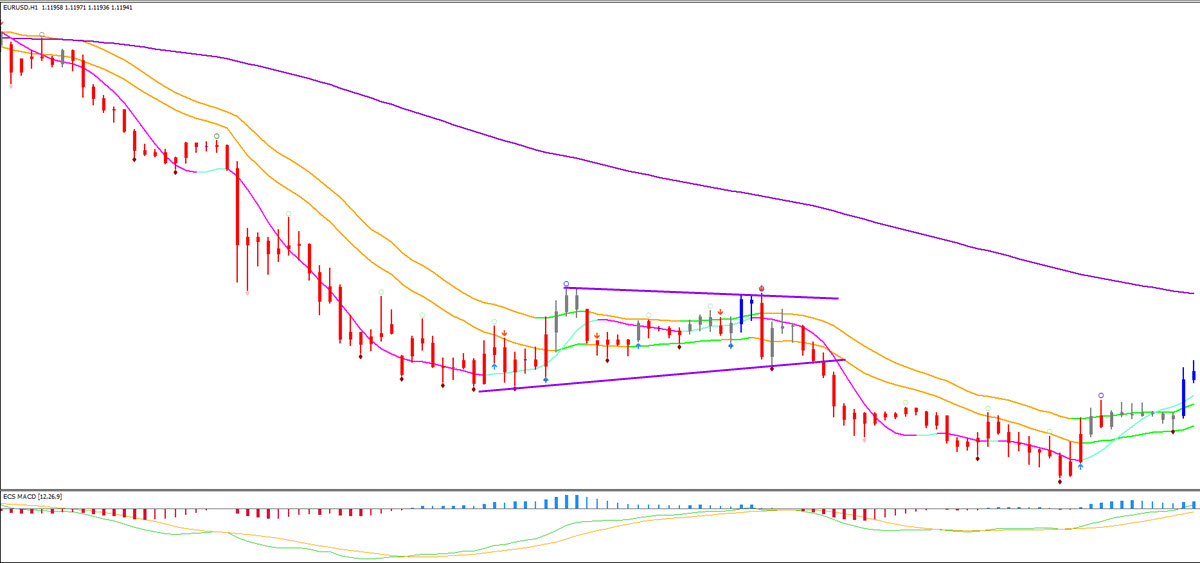
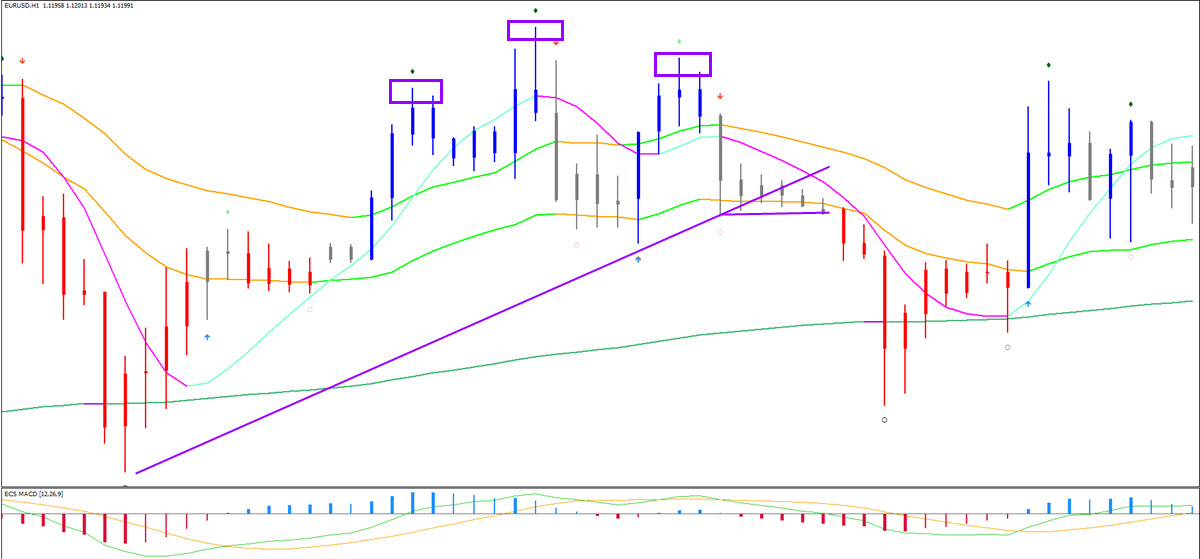
A key for avoiding false breaks is using the concept of trading the breakout after the pattern break. The best is to zoom into one time frame lower. So if the breakout is occurring on a 4 hour chart, then the next time frame to analyze is the 1 hour chart. With a daily chart, it’s best to see a 4 hour chart. With a 1 hour chart, go to the 15 minute chart. Why? Because I am able to read and understand the psychology of the market better by seeing the internal price action develop within the breakout itself. That sounds perhaps complicated so let me simplify it. On a lower time frame, traders are able to see the reaction after the breakout: Is price moving correctively? Or is price moving impulsively against the direction of the breakout?
Situation A: when price moves correctively, it is building another chart pattern. This indicates a strong breakout because price is in fact building a new correction after momentum. The market is therefore of no interest in the other direction. This is a continuation signal indicated by the market psychology of price.
Situation B: when price does not build a pattern after the breakout and it moves impulsively against the breakout direction, it is indicating a potential reversal and change of trend direction. It could be a false breakout or the presence of major support and resistance levels (from a higher time frame). Either way, best practice is to avoid this setup. Only when situation A appears, will breakout traders continue with this breakout trading system and implement the next step.
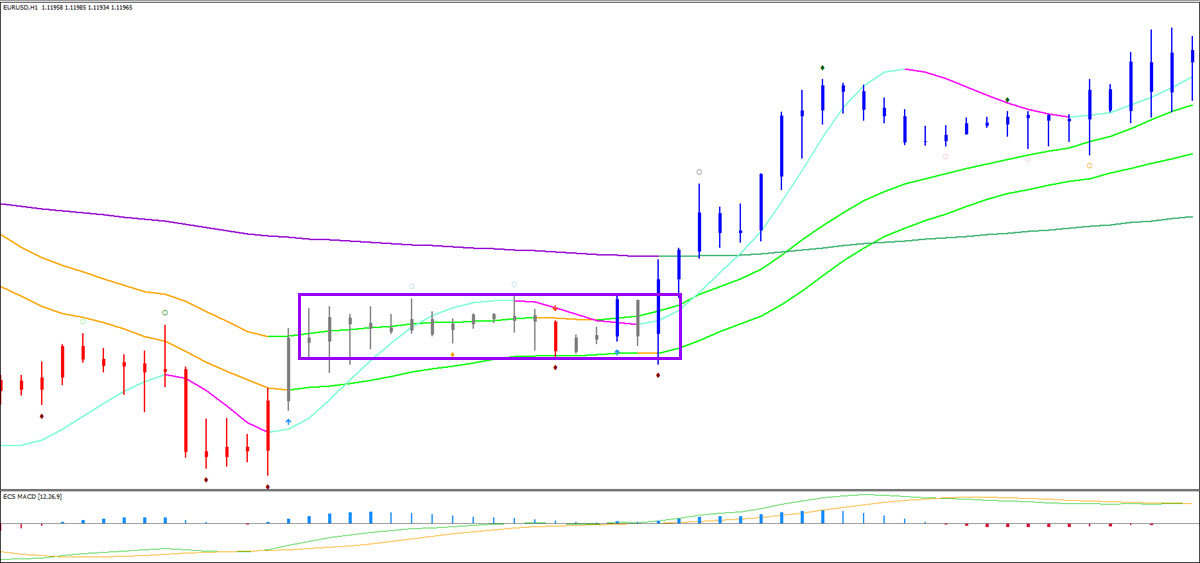
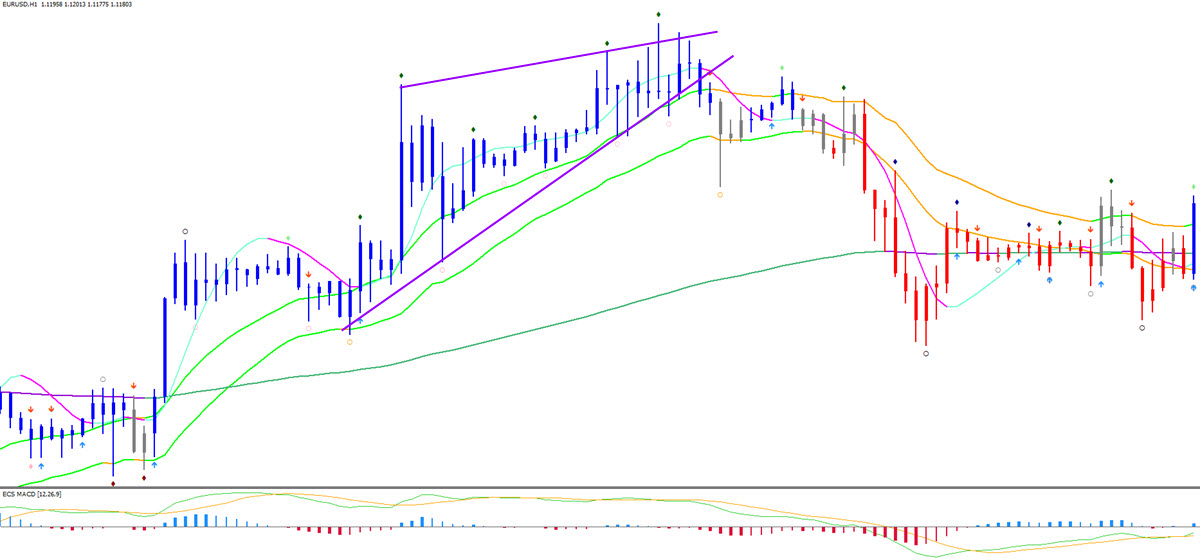
The final step of our journey in trading breakout patterns is waiting for the break of the pattern on the lower time frame. This corrective pattern should not last too long and it should be a relatively quick pullback and breakout continuation. Anything from I think 13 candles to 24 is fine. From 24 to 36 could be ok depending on the overall market structure. All of this is explained in our course called SWAT – simple wave analysis and trading.
The break of the corrective pattern on the lower time frame is trading the breakout of the pattern break. So basically, this is trading the break of the break. In this lower time frame, traders can look for a good breakout candle, a break of a trend line, a break of a fractal or use our ecs.SWAT method for the actual trigger and entry.
Waiting for the setup does take some patience but it will be worth it in the long run. I love trading breakouts by zooming in one time frame because it provides me with more exact detail and information. This in turn makes me feel more patience, plus it also provides more control over the breakout development.
These are the key steps:
- Find the chart pattern
- Find the correct time frame
- Wait for a breakout
- Zoomin one time frame
- Wait for a smaller pattern Enter next breakout
For more information, free analysis, webinars, videos, tools, systems, and methods for trading stocks, cryptos, Forex and options, please check out my website www.EliteCurrenSea.com.
Wish you good trading,
Chris Svorcik


Leave a Reply