All Angles of Defining the Trend Properly (part 5)
Subscribe
Hi Traders,
Have you ever wondered how to define the trend properly?
This article will dive into how traders can recognise trends and draw the best trend lines.
We will also address questions like what do shallow trend lines represent and how can traders approach steep trend lines?
First let’s discuss trend lines as a support and resistance (S&R).
Trend line S&R
The basic characteristic of a trend line is that it connects various points on the chart. Typically trend lines connect areas or points of support OR resistance with each other.
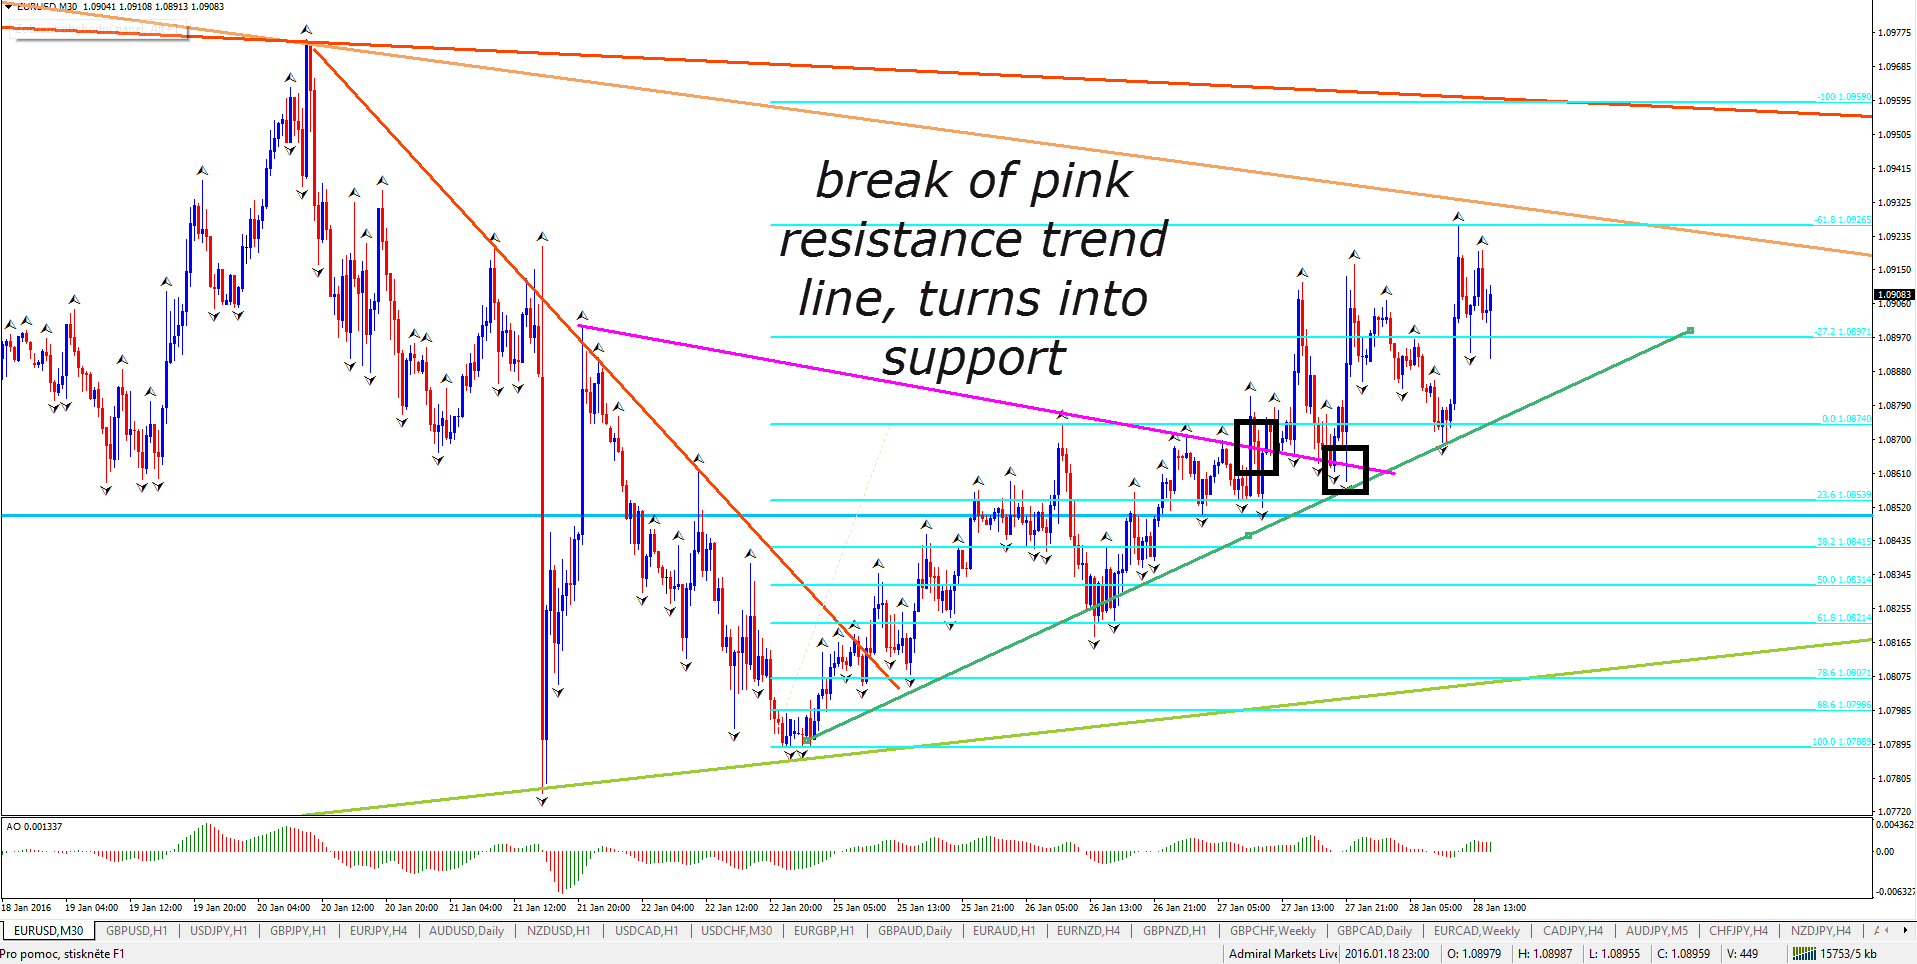
In some cases trend lines that acted as support or resistance in the past will have the reserve role after price breaks through that trend line.
Trend line hits
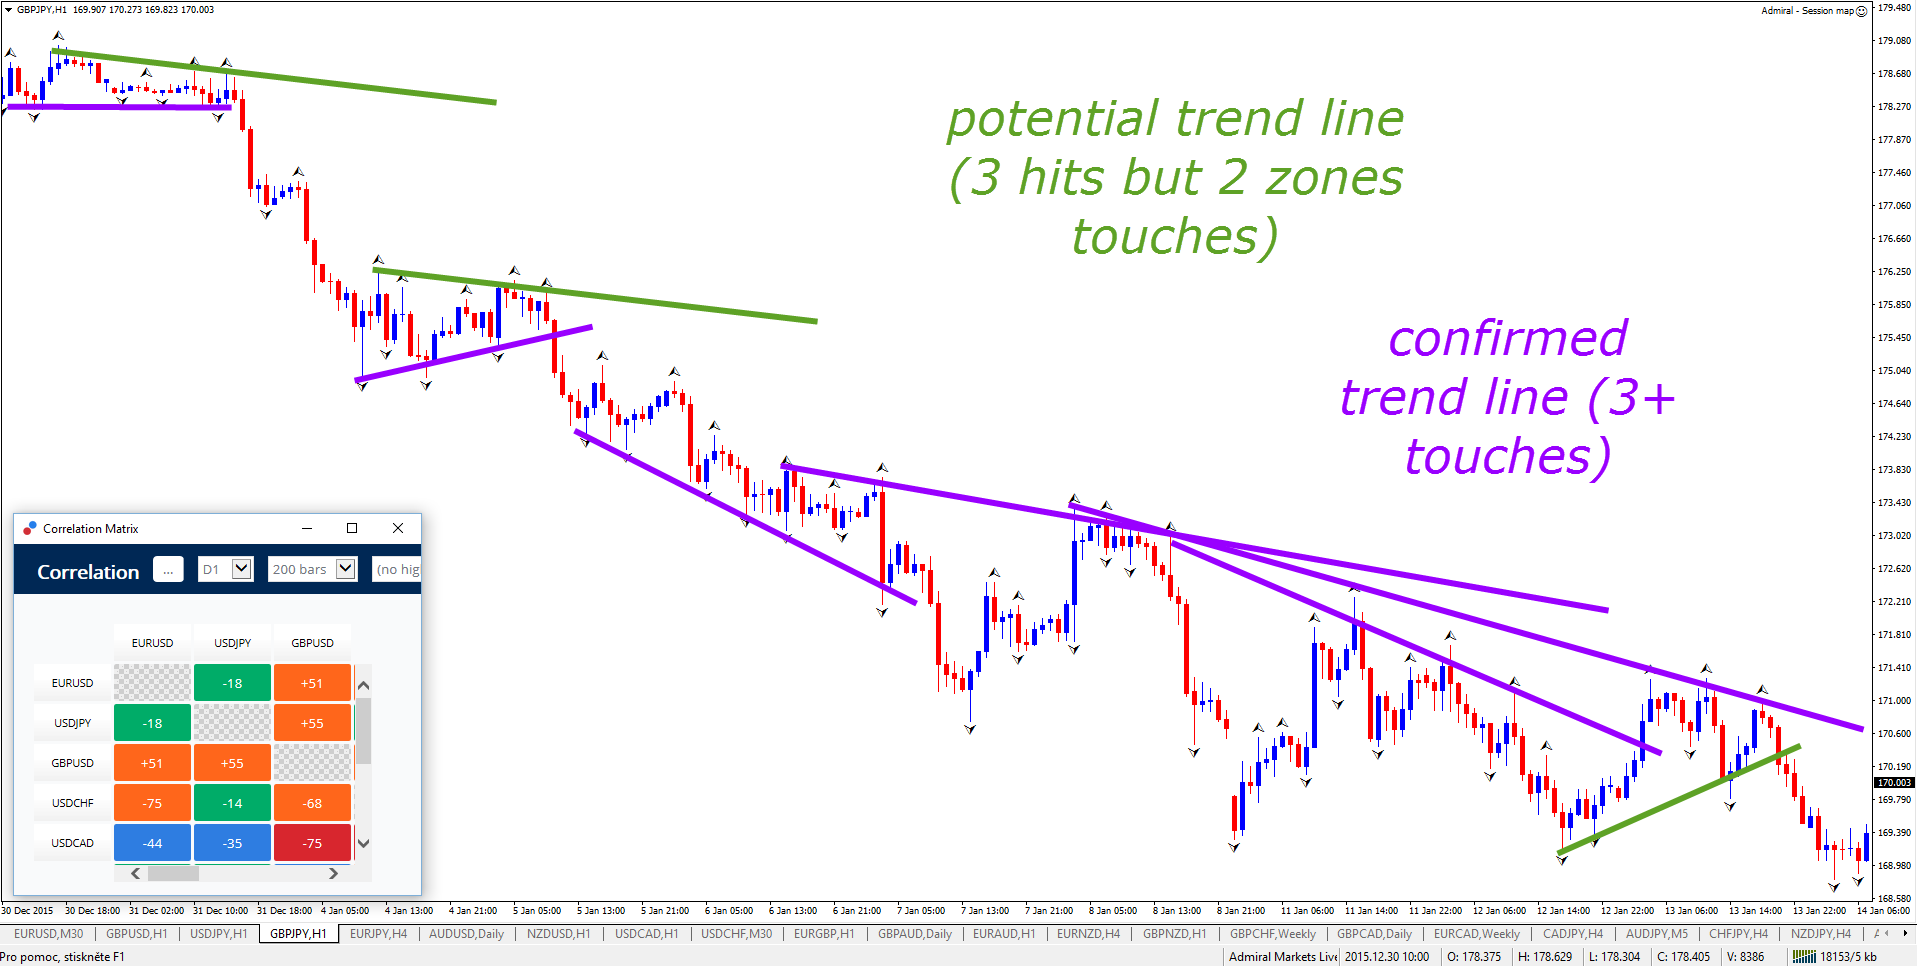
A trend line has move value and is regarded as a stronger line when price touches it multiple times. The minimum is 2 hits, which is a potential trend line. When 3 hits or more are visible then the trend line is confirmed.
Price could show multiple hits on a trend line in 1 price zone. Often I count all of these hits as 1 and consider multiple zone touches to be a stronger signal.
Trend line break and bounce
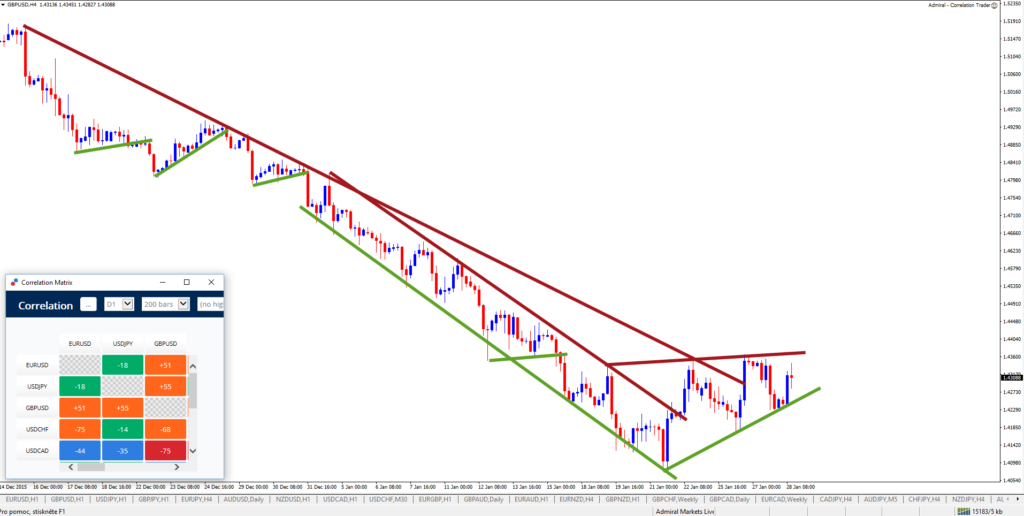
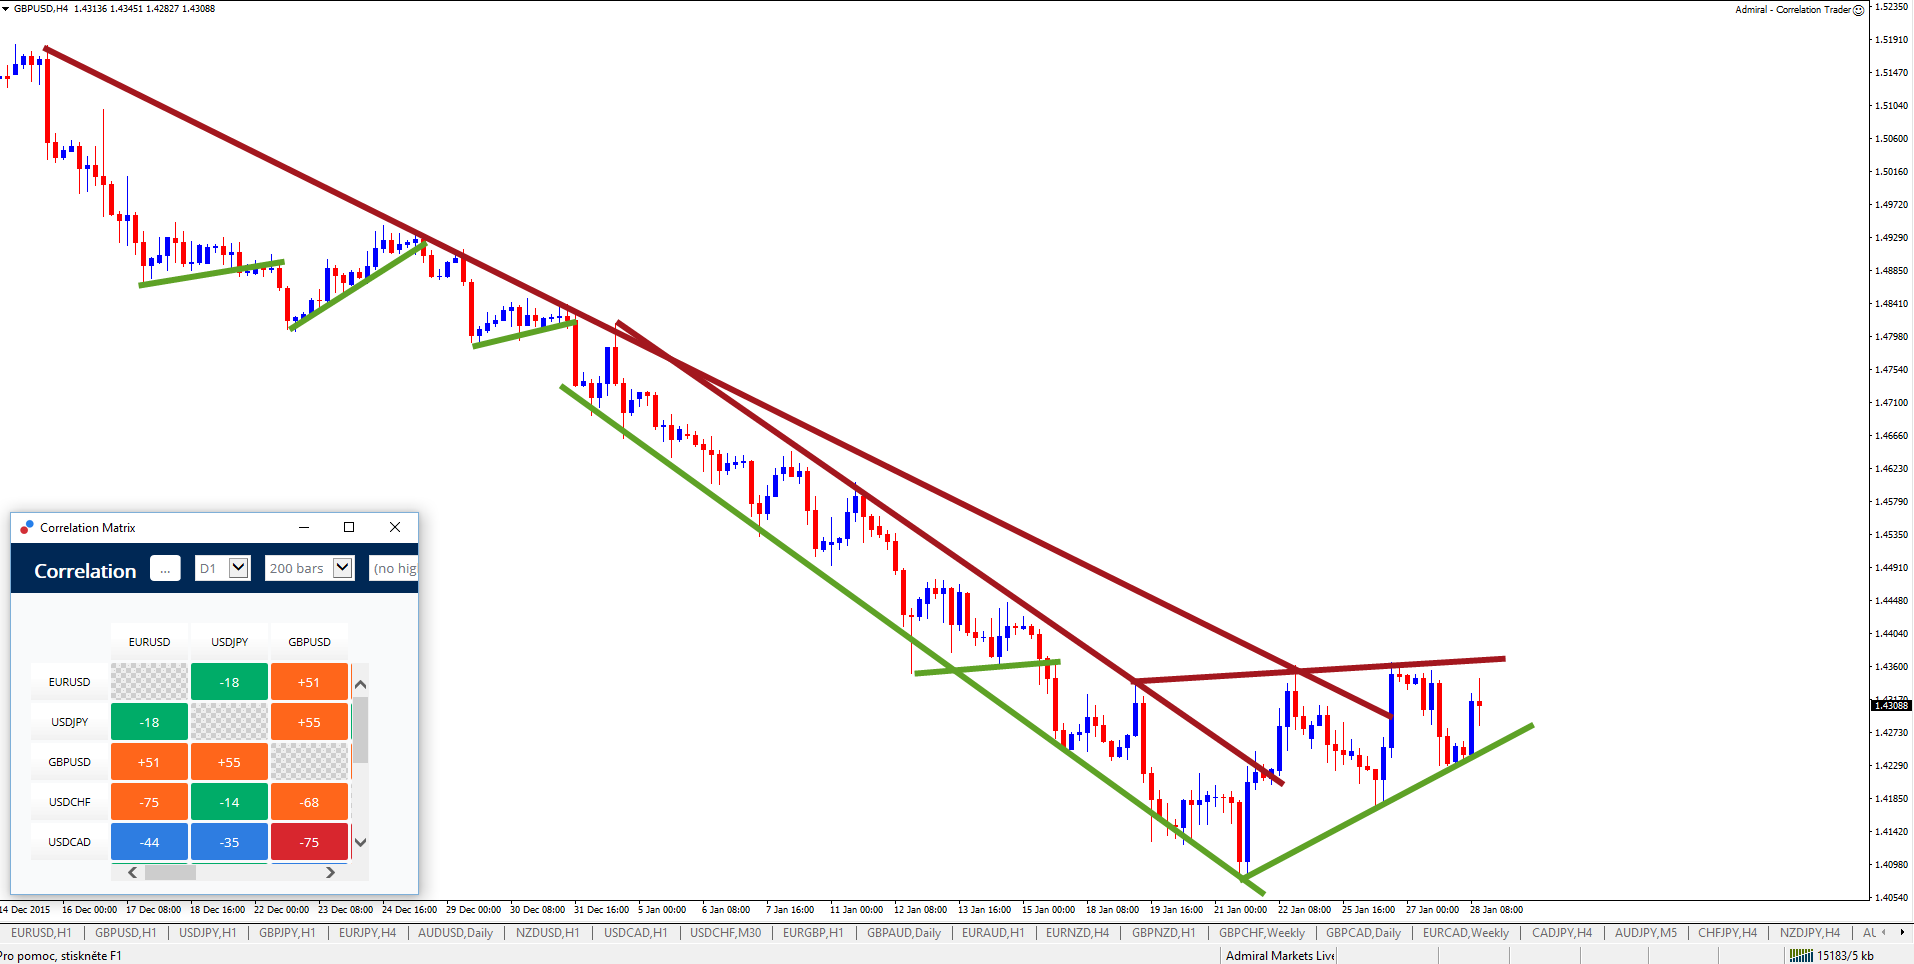
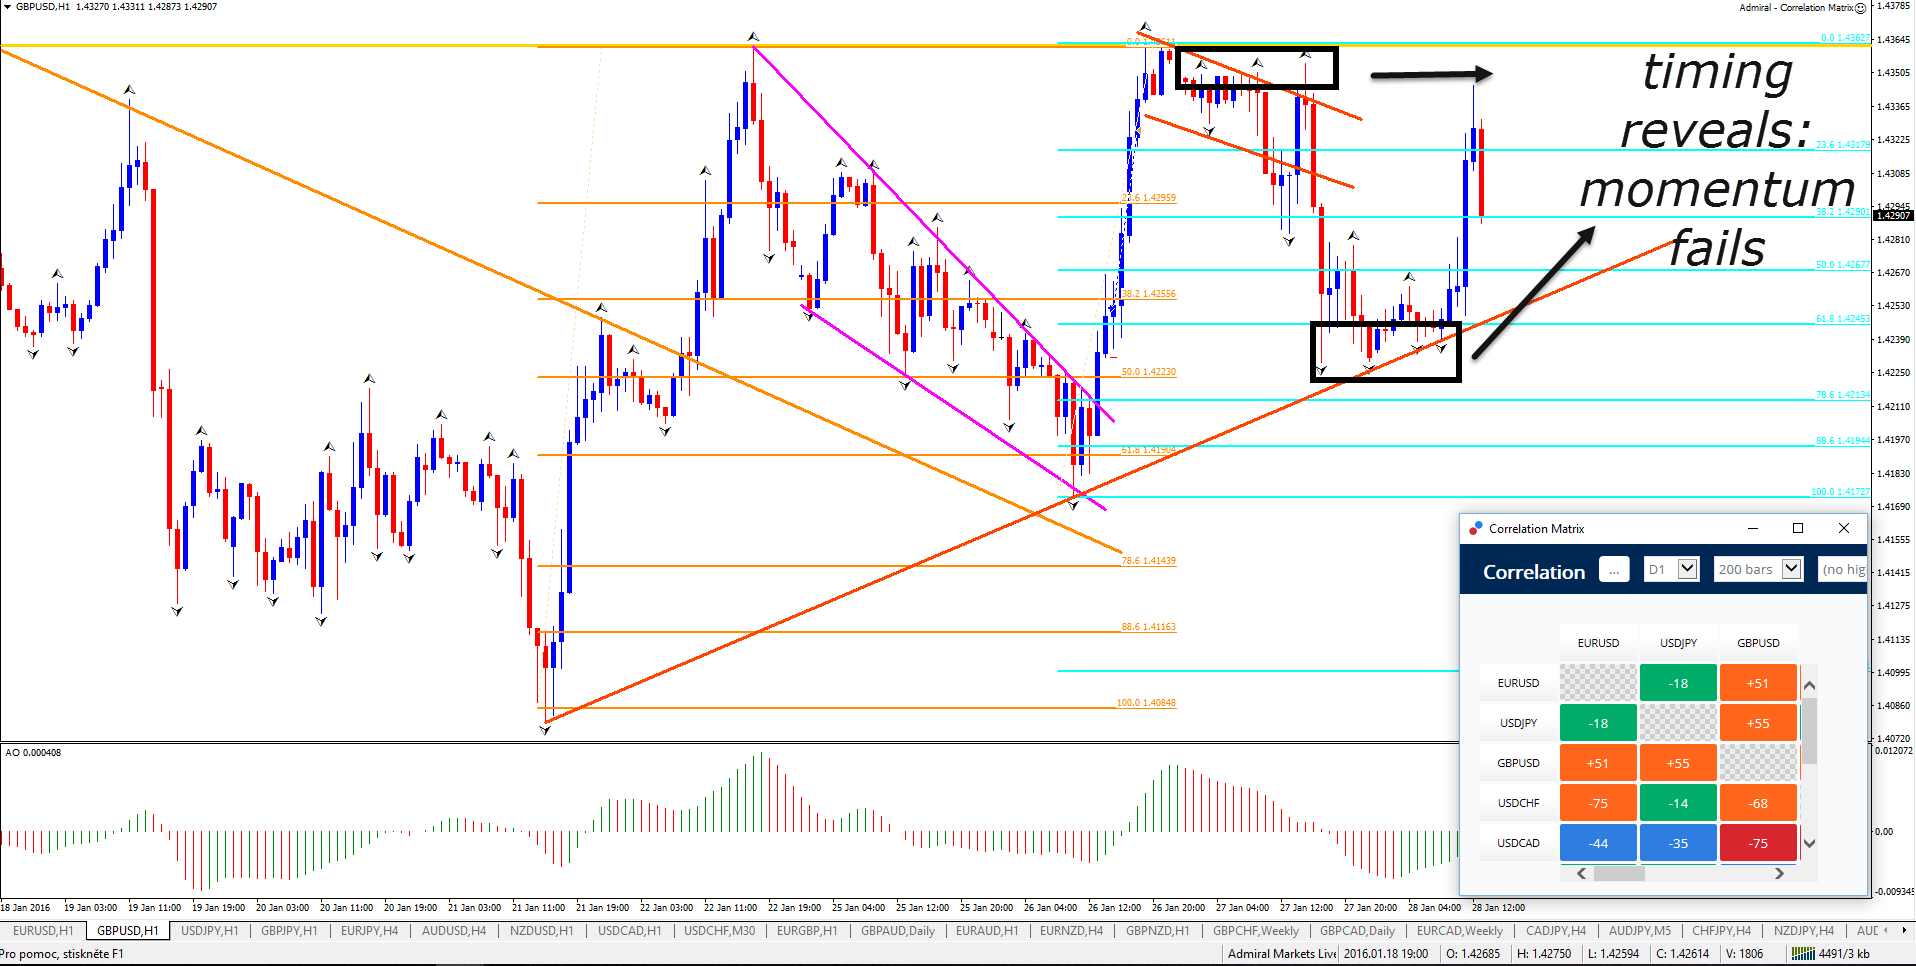
Once a trend line is visible, then traders can use that tool as an indication where and when price will bounce at or break the trend line. Trend lines are great bounce and break spots and you can see that I predicted a trend line break and bounce on the GBPUSD charts.
Trend line characteristics
Proximity and relevance: trend lines are only useful obviously if they are relatively near price action. A trend line that is hundreds of pips away from a 1 hour trend line will probably not add much value to your charting analysis.
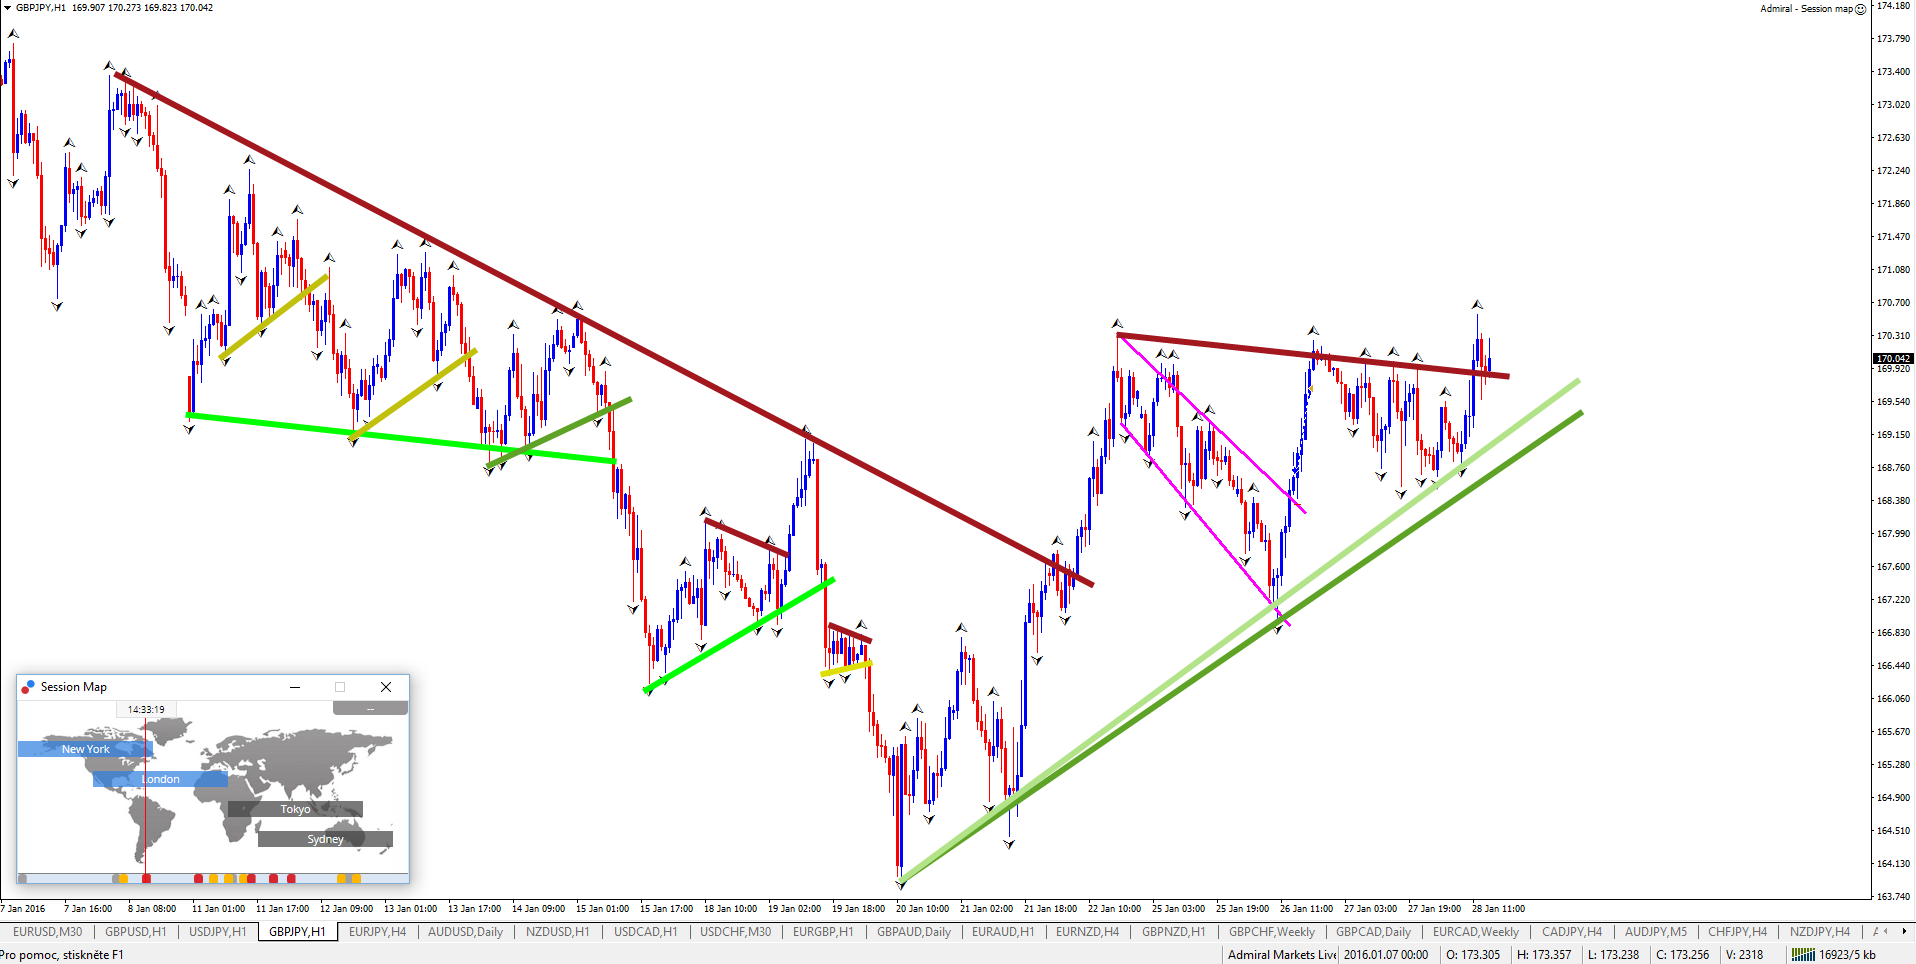
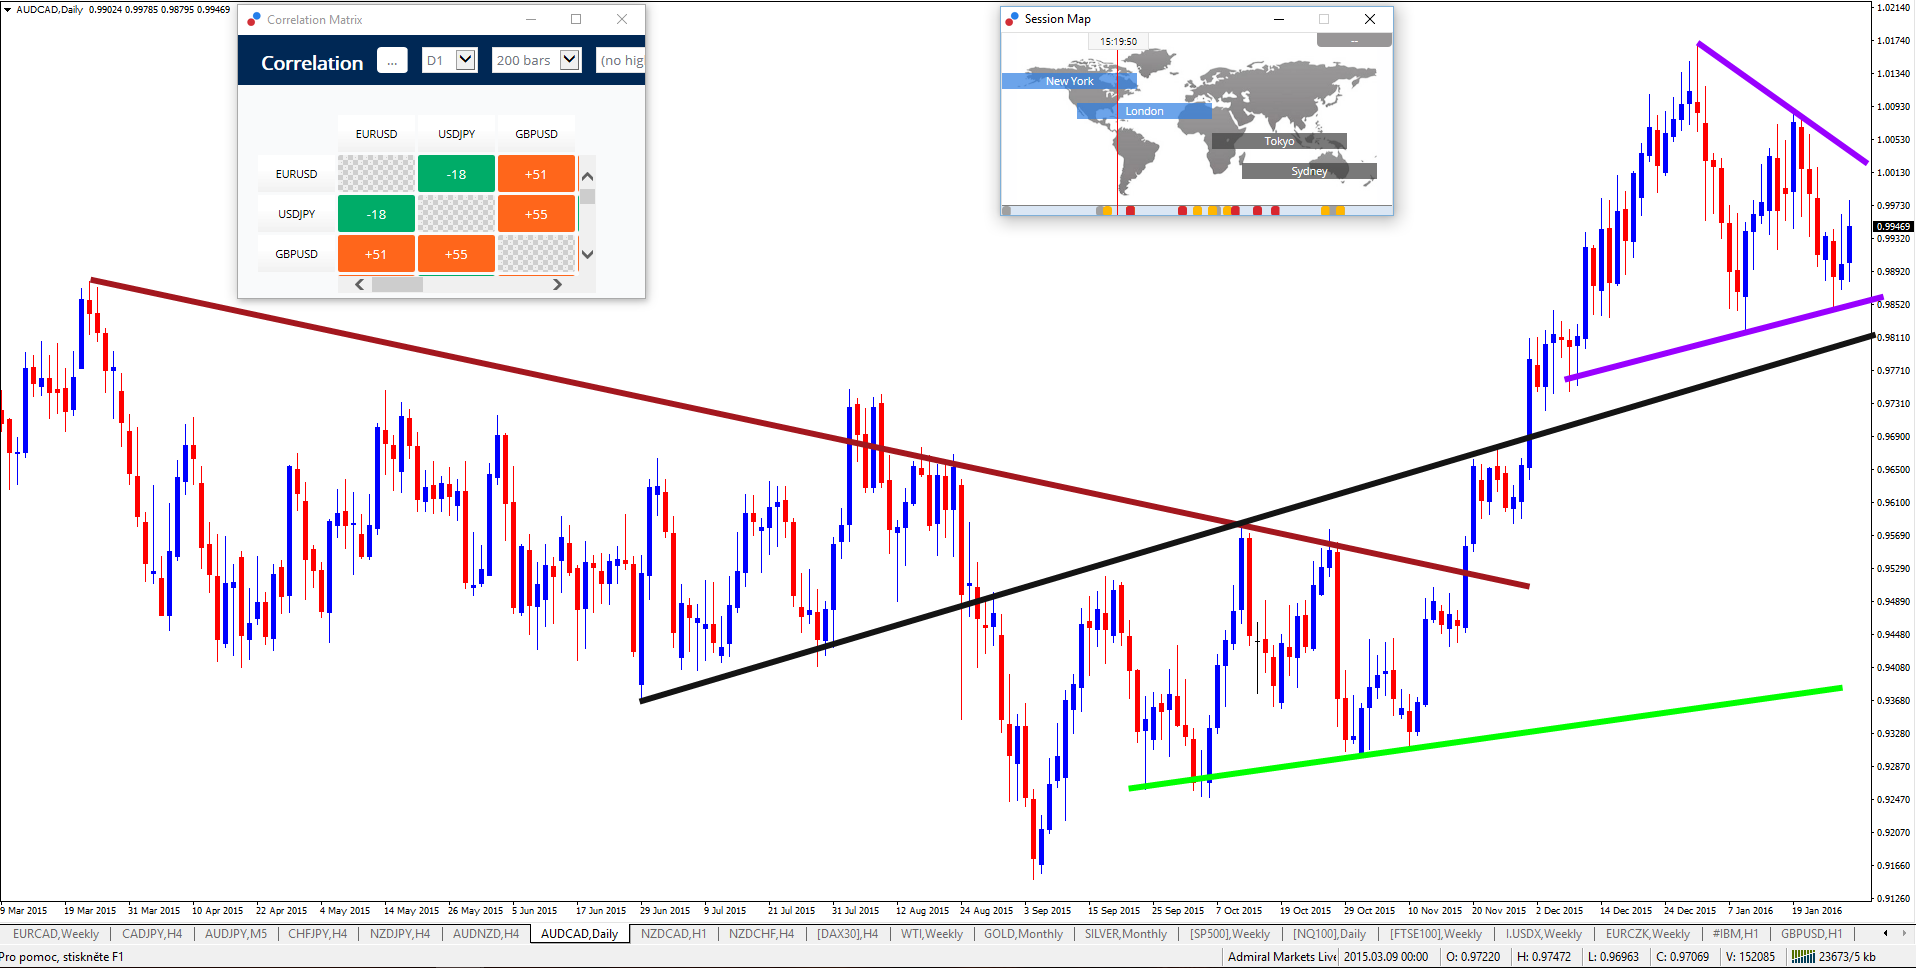
Multiple trend lines: there is no rule that tells traders they can draw only 1 trend line on the chart. Feel free to connect multiple points and keep them on the chart because all of them represent a decision spot. Although you can add as many trend lines as you feel are needed, make sure not to over crowd your chart because you want to avoid paralysis of analysis.
Old trend lines: keeping some of the older trend lines on the chart is OK especially when you expect them to provide support and resistance in the opposite direction. Old trend lines can be great points of chart confluence.
Cutting through candles or wicks (dark red): trend lines can cut through part of the candle or wicks of the candle if the trend line becomes a “better” trend line due to more hit(s), a more sustainable angle, more space between the hits.
Steep trend lines (outer)
A steep trend line indicates that price action is behaving very impulsively. Price is moving quickly in a momentum and therefore the trend line is steep as well. Any angle more than 45 degrees on a chart with +/- 150 candles is considered steep.
These trend lines can be used for finding continuation trades within the momentum. But be careful not to carry away with this practice because eventually price will fail to continue in the momentum and will show a larger correction.
The breakout of a steep trend line could be an entry setup as well, however this needs to be treated with even more caution. The break of a steep trend line could just be an expanded correction and nothing more. Traders run the risk of price going only a bit in their favor before the trade setup runs into trouble. The counter trend break could make sense if the momentum is going against the trend direction of a larger time frame.

Medium trend lines
Price is showing periods of impulse and corrections which makes the channel angle not too steep or shallow. An angle less than 45 degrees but more than 20 degrees on a chart with +/- 150 candles is considered medium. These trend lines offer both bounce and break opportunities.
Shallow trend lines (inner)
Price is showing a correction which makes the channel angle shallow. An angle less than 20-25 degrees on chart with +/- 150 candles is considered shallow. These trend lines offer better break out opportunities and sometimes bounces in the direction of the bigger trend.
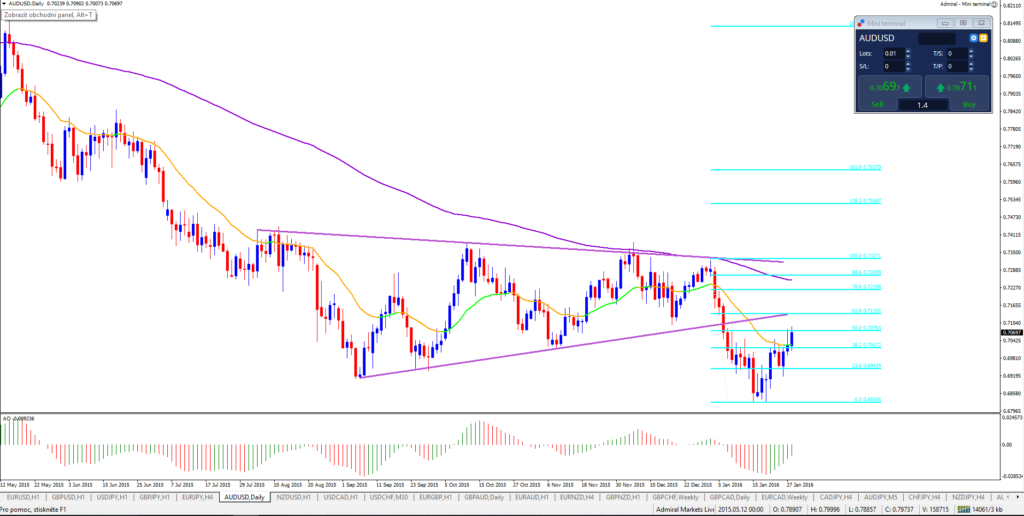
Shallow trend lines occur when price is correcting so it makes sense to look for breakouts above the correction, most notably when price has made an impulse prior to the correction.
A bounce setup could occur in the correction pattern as well, such as a bullish bounce and long setup at the bottom of a bull flag or a bearish setup at the top of a bull flag.
Cheers and good trading,
Chris
Twitter: @elitecurrensea
Youtube: Elite CurrenSEA
Live webinars at: Admiral Markets
Trend series part 1 , part 2, part 3, part 4.
Before leaving, make sure to read our entire Fibonacci series!


Leave a Reply